Geographical Information Systems - Part 2 (Coursera)

Geographical Information Systems - Part 2 (Coursera)

This course is the second part of a course dedicated to the theoretical and practical bases of Geographic Information Systems (GIS). It offers an introduction to GIS that does not require prior computer skills. It gives the opportunity to quickly acquire the basics that allow you to create spatial databases and produce geographic maps. This is a practical course that relies on the use of free Open Source software (QGIS, Geoda).

Class Deals by MOOC List - Click here and see Coursera's Active Discounts, Deals, and Promo Codes.

In the first part of the course (Geographical Information Systems - Part 1), you explored the basics of land digitization and geodata storage. In particular, you learned how to:

  • Characterize spatial objects and phenomena (spatial modeling) from the point of view of their positioning in space (coordinate systems and projections, spatial relationships) and according to their intrinsic nature (object or vector mode vs. image or raster mode);
  • Use various data acquisition methods (direct measurement, georeferencing of images, digitization, existing data source, etc.);
  • Use various geodata storage methods (simple files and relational databases);
  • Use data modeling tools to describe and implement a database;
  • Create queries in a query language and data manipulation.

The second part of the course deals with spatial analysis methods and georeferenced information representation techniques. In particular, you will learn how to:

  • Analyze the spatial properties of discrete variables, for example by quantifying spatial autocorrelation;
  • Work with continuous variables (sampling, interpolation and construction of isolines)
  • Use digital elevation models (DEMs) and their derivatives (slope, orientation, etc.);
  • Use geodata superposition techniques;
  • Produce cartographic documents according to the rules of the semiology of graphics;
  • Explore other forms of spatial representation (interactive cartography on the internet, 3D representations, and augmented reality).

Syllabus

WEEK 1
Discrete Spatial Phenomena (Module 3)
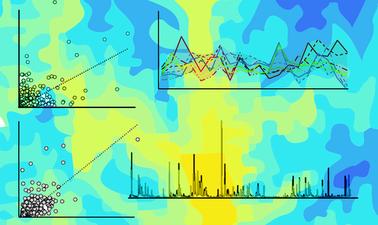
Objects in geographic space are modeled as discontinuous spatial phenomena whose properties are defined according to the geometric, thematic and spatial dimensions: geometric. The properties of these spatial objects can be described by different indices that characterize an object’s shape, size, spatial distribution or even its spatial dependence. When considered simultaneously, in conjunction with the study context, these indices describe the landscape under investigation.

WEEK 2
Continuous Spatial Phenomena (Module 3)
A phenomenon is considered spatially continuous if it is defined at all points in geographic space, and if its properties vary locally in a gradual and structured manner. Elevation, soil humidity, heavy metal concentration and other soil contaminants are common examples of continuous spatial phenomena. This module will begin by touching on different sampling methods, then deterministic interpolation methods that do not require any a priori study of the phenomenon. Working to the heart of the lesson, we will then introduce geostatistics, which are based on the notion of random functions, and we will finish by discussing the concepts and application of regionalized variables, variogram analysis and kriging.

WEEK 3
Digital Elevation Models (Module 3)
Topographical relief plays both a revealing and explanatory role in determining the way phenomena unfold on the Earth’s surface. It constitutes an important element in the determination of human settlement patterns and also controls environmental conditions that favor, or hamper, the establishment and development of different plant and animal colonies. Correspondingly, relief occupies a central position in spatial analysis and is important for any discipline that is interested in human activity or natural phenomena. This chapter will present a brief overview of the different methods used to acquire elevation data and will also cover the algorithms, and their properties, that are used to derive important descriptive indicators of relief.

WEEK 4
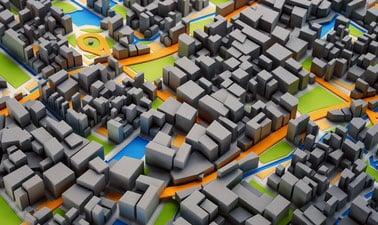
Integrating Data Layers (Module 3)
Through spatial overlay, GIS can be used to combine data from different sources or in different formats (raster or vector) by transferring information between layers according to their spatial relationships. Often the analysis of geographically distributed phenomena requires that data from different sources can be considered simultaneously. This is made possible through spatial overlay - the defining functionality and primary advantage of geographic information systems.

WEEK 5
Thematic Mapping and the Semiology of Graphics (Module 4)
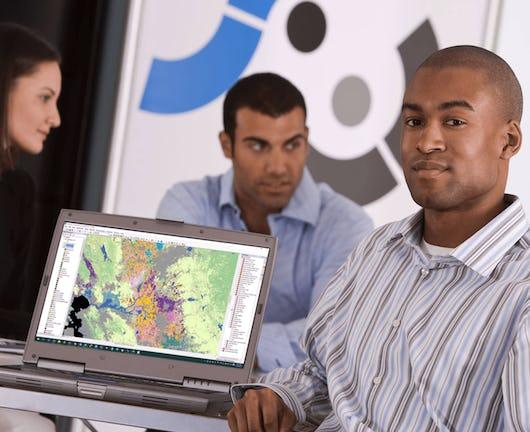
This week, you will learn how apply established rules from thematic mapping in order to effectively present geographic information. You will learn how to treat quantitative or qualitative information, and we will show you how to use the QGIS Print Composer so that you can create your own thematic maps. Thematic maps should be created with a certain number of constraints in mind. These rules - for example, to choose color palettes that respect the semiology of graphics, to ensure that your map includes a number of essential components such as a legend, scale, data sources and description – ensure efficient information transfer and effective interpretation.

WEEK 6
Other Forms of Representation (Module 4)
In this final week of our course, we will focus on alternative methods of representing geographic information, particularly through dynamic web-based mapping, three dimensional representations and, finally, we will see how augmented reality can be incorporated into geographic information systems.

Go to Class
MOOC List is learner-supported. When you buy through links on our site, we may earn an affiliate commission.

Related Courses

Digital Signal Processing 3: Analog vs Digital (Coursera) Coursera
École Polytechnique Fédérale de Lausanne

Digital Signal Processing 3: Analog vs Digital (Coursera)

Digital Signal Processing is the branch of engineering that, in the space of just a few decades, has enabled unprecedented levels of interpersonal communication and of on-demand entertainment. By reworking the principles of electronics, telecommunication and computer science into a unifying paradigm, DSP is a the heart of the digital revolution that brought us CDs, DVDs, MP3 players, mobile phones and countless other devices.

May 25th 2026
4 Weeks
Introduction aux Systèmes d’Information Géographique - Partie 1 (Coursera) Coursera
École Polytechnique Fédérale de Lausanne

Introduction aux Systèmes d’Information Géographique - Partie 1 (Coursera)

Organisé en deux parties, ce cours présente les bases théoriques et pratiques des systèmes d’information géographique. - Il propose une introduction aux systèmes d’information géographique qui ne requiert pas de connaissances préalables en informatique - Il donne la possibilité d’acquérir rapidement les notions de base qui vous permettent de créer des bases de données spatiales et de fabriquer des cartes géographiques - Il s’agit d’un cours pratique qui repose sur l’utilisation de logiciels libres, notamment QGIS.

Jun 1st 2026
5-12 Weeks
Cartography (Esri) Esri
Esri

Cartography (Esri)

Once, only cartographers made maps. Today anyone can. Still, cartographers can teach people to make better maps, just as chefs can show people how to cook better meals. With coaching from experienced cartographers and practical, hands-on exercises using ArcGIS Pro, you'll become a smarter mapmaker, ready to go beyond the defaults and make better maps.

Feb 16th 2022
5-12 Weeks
Computational Watershed Hydrology (edX) EdX
Purdue University,PurdueX

Computational Watershed Hydrology (edX)

Learn how to perform hydrologic analysis and modeling using real observations, geospatial data, and computational tools. Students in this class will learn how to access and process commonly used geospatial and temporal data such as the digital elevation model (DEM), land use, soil, streamflow and precipitation using geographic information systems (GIS).

Jan 10th 2022
13-24 Weeks
Geohealth: Improving Public Health through Geographic Information (FutureLearn) FutureLearn
University of Twente

Geohealth: Improving Public Health through Geographic Information (FutureLearn)

Explore how spatial data and geographic information systems (GIS) can be used to understand and improve public health. The environment in which we live and work can have a profound effect on our health – an effect that is explored by the emerging field of geohealth. This free online course will introduce you to new developments in geohealth, looking at the latest thinking and methods for using spatial data and geographic information systems (GIS) in health settings.

No sessions available
4 Weeks
Spatial Analysis with SAP HANA Platform (openSAP) OpenSAP
SAP

Spatial Analysis with SAP HANA Platform (openSAP)

Today, enterprises and organizations collect and analyze huge volumes of data about everything from products and customers to assets, operations, and transactions. With SAP HANA, you can add a new dimension of intelligence by analyzing spatial data. SAP’s in-memory data management platform not only provides the technology for building geospatial applications, but also geo-content and services, along with a strong partner network. Learn how to leverage SAP HANA’s capabilities for spatial analysis and application development.

Self Paced
Self-Paced
Introduction to Geospatial Technology Using QGIS (Canvas.net) Canvas Network
Del Mar College

Introduction to Geospatial Technology Using QGIS (Canvas.net)

This course provides a rich introduction to the booming technology field of Geographic Information Systems, known as GIS. The GIS industry is exploding at double-digit employment and income numbers and promises employment opportunities well into the future. Students will learn the fundamentals of GIS and how to build digital maps using open source software that allows free unlimited use for private or commercial applications. All data and software required is included in the course.

No sessions available
No Information
Geographical Information Systems - Part 1 (Coursera) Coursera
École Polytechnique Fédérale de Lausanne

Geographical Information Systems - Part 1 (Coursera)

This course is organized into two parts presenting the theoretical and practical foundations of geographic information systems (GIS). Together theses courses constitute an introduction to GIS and require no prior knowledge. By following this introduction to GIS you will quickly acquire the basic knowledge required to create spatial databases and produce high-quality maps and cartographic representations. This is a practical course and is based on free, open-source software, including QGIS.

May 25th 2026
5-12 Weeks
Geospatial and Environmental Analysis (Coursera) Coursera
University of California, Davis

Geospatial and Environmental Analysis (Coursera)

Apply your GIS knowledge in this course on geospatial analysis, focusing on analysis tools, 3D data, working with rasters, projections, and environment variables. Through all four weeks of this course, we'll work through a project together - something unique to this course - from project conception, through data retrieval, initial data management and processing, and finally to our analysis products.

Mar 18th 2024
4 Weeks