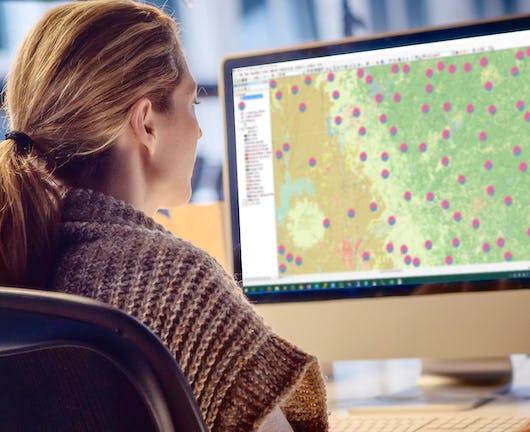
Spatial (map) is considered as a core infrastructure of modern IT world, which is substantiated by business transactions of major IT companies such as Apple, Google, Microsoft, Amazon, Intel, and Uber, and even motor companies such as Audi, BMW, and Mercedes. Consequently, they are bound to hire more and more spatial data scientists. Based on such business trend, this course is designed to present a firm understanding of spatial data science to the learners, who would have a basic knowledge of data science and data analysis, and eventually to make their expertise differentiated from other nominal data scientists and data analysts.
Class Deals by MOOC List - Click here and see Coursera's Active Discounts, Deals, and Promo Codes.
Additionally, this course could make learners realize the value of spatial big data and the power of open source software's to deal with spatial data science problems.
This course will start with defining spatial data science and answering why spatial is special from three different perspectives - business, technology, and data in the first week. In the second week, four disciplines related to spatial data science - GIS, DBMS, Data Analytics, and Big Data Systems, and the related open source software's - QGIS, PostgreSQL, PostGIS, R, and Hadoop tools are introduced together. During the third, fourth, and fifth weeks, you will learn the four disciplines one by one from the principle to applications. In the final week, five real world problems and the corresponding solutions are presented with step-by-step procedures in environment of open source software's.
Syllabus
WEEK 1
Understanding Spatial Data Science
The first module of "Spatial Data Science and Applications" is entitled to "Understanding of Spatial Data Science." This module is composed of four lectures. The first lecture "Introduction to spatial data science" was designed to give learners a solid concept of spatial data science in comparison with science, data science, and spatial data science. For Learner's better understanding, examples of spatial data science problems are also presented. The second, third, and fourth lectures focuses on "what is spatial special? - unique aspects of spatial data science from three perspectives of business, technology, and data, respectively. In the second lecture, learners will learn five reasons why major IT companies are serious about spatial data, in other words, maps. The third lecture will allow learners to understand four issues of dealing with spatial data, including DBMS problems, topology, spatial indexing, and spatial big data problems. The fourth lecture will allow learners to understand another four issues of spatial data including spatial autocorrelation, map projection, uncertainty, and modifiable areal unit problem.
WEEK 2
Solution Structures of Spatial Data Science Problems
The second module is entitled to "Solution Structures of Spatial Data Science Problems", which is composed of four lectures and will give learners an overview of academic subjects, software tools, and their combinations for the solution structures of spatial data science problems. The first lecture, "Four Disciplines for Spatial Data Science and Applications" will introduce four academic disciplines related to spatial data science, which are Geographic Information System (GIS), Database Management System (DBMS), Data Analytics, and Big Data Systems. The second lecture "Open Source Software's" will introduce open source software's in the four related disciplines, QGIS for GIS, PostgreSQL and PostGIS for DBMS, R for Data Analytics, Hadoop and Hadoop-based solutions for Big Data System, which will be used throughout this course. The third lecture "Spatial Data Science Problems" will present six solution structures, which are different combinations of GIS, DBMS, Data Analytics, and Big Data Systems. The solution structures are related to the characteristics of given problems, which are the data size, the number of users, level of analysis, and main focus of problems. The fourth lecture "Spatial Data vs. Spatial Big Data" will make learner have a solid understanding of spatial data and spatial big data in terms of similarity and differences. Additionally, the value of spatial big data will be discussed.
WEEK 3
Geographic Information System (GIS)
The third module is "Geographic Information System (GIS)", which is one of the four disciplines for spatial data science. GIS has five layers, which are spatial reference framework, spatial data model, spatial data acquisition systems, spatial data analysis, and geo-visualization. This module is composed of six lecture. The first lecture "Five Layers of GIS" is an introduction to the third module. The rest of the lectures will cover the five layers of GIS, one by one. The second lecture "Spatial Reference Framework" will make learners understand, first, a series of formulation steps of physical earth, geoid, ellipsoid, datum, and map projections, second, coordinate transformation between different map projections. The third lecture "Spatial Data Models" will teach learners how to represent spatial reality in two spatial data models - vector model and raster model. The fourth lecture "Spatial Data Acquisition Systems" will cover topics on how and where to acquire spatial data and how to produce your own spatial data. The fifth lecture "Spatial Data Analysis", will make learners to have brief taste of how to extract useful and valuable information from spatial data. More advanced algorithms for spatial analysis will be covered in the fifth module. In the sixth lecture "Geovisualization and Information Delivery", learners will understand powerful aspects as well as negative potentials of cartographic representations as a communication media of spatial phenomenon.
WEEK 4
Spatial DBMS and Big Data Systems
The fourth module is entitled to "Spatial DBMS and Big Data Systems", which covers two disciplines related to spatial data science, and will make learners understand how to use DBMS and Big Data Systems to manage spatial data and spatial big data. This module is composed of six lectures. The first two lectures will cover DBMS and Spatial DBMS, and the rest of the lectures will cover Big Data Systems. The first lecture "Database Management System (DBMS)" will introduce powerful functionalities of DBMS and related features, and limitations of conventional Relational DBMS for spatial data. The second lecture "Spatial DBMS" focuses on the difference of spatial DBMS from conventional DBMS, and new features to manage spatial data. The third lecture will give learners a brief overview of Big Data Systems and the current paradigm - MapReduce. The fourth lecture will cover Hadoop MapReduce, Hadoop Distributed File System (HDFS), Hadoop YARN, as an implementation of MapReduce paradigm, and also will present the first example of spatial big data processing using Hadoop MapReduce. The fifth lecture will introduce Hadoop ecosystem and show how to utilize Hadoop tools such as Hive, Pig, Sqoop, and HBase for spatial big data processing. The last lecture "Spatial Big Data System" will introduce two Hadoop tools for spatial big data - Spatial Hadoop and GIS Tools for Hadoop, and review their pros and cons for spatial big data management and processing.
WEEK 5
Spatial Data Analytics
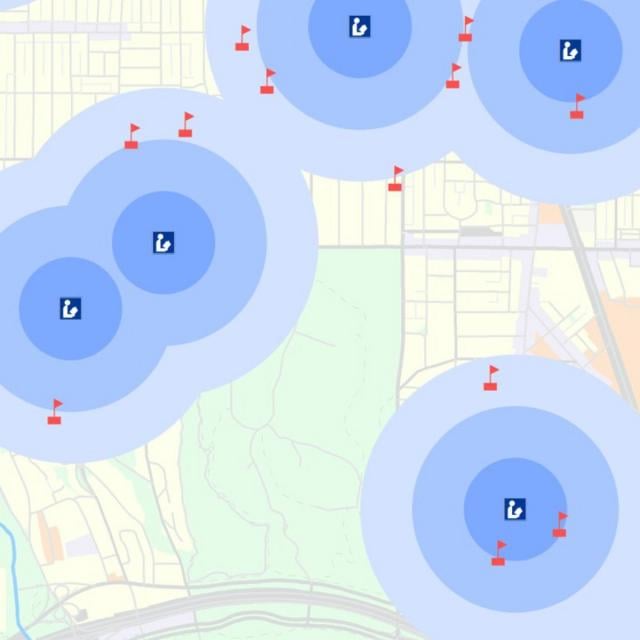
The fifth module is entitled to "Spatial Data Analytics", which is one of the four disciplines related to spatial data science. Spatial Data Analytics could cover a wide spectrum of spatial analysis methods, however, in this module, only some portion of spatial data analysis methods will be covered. The first lecture is an introduction, in which an overview of Spatial Data Analytics and a list of six topics are given and discussed. The second lecture "Proximity and Accessibility" will make learners realize how spatial data science can be used for business applications, while trade area analysis, supply to demand ratio, Floating Catchment Analysis (FCA), and Gravity-based index of accessibility are introduced and applied to real world problems. The third lecture "Spatial Autocorrelation" will give an instruction on how to measure spatial autocorrelation and to apply hypothesis test with Moran's I. The fourth lecture "Spatial Interpolation" will introduce trend surface analysis, inverse distance weighting, and Kriging. Particularly, in-depth explanations regarding Kriging, a de facto standard of spatial interpolation will be presented. The fifth lecture "Spatial Categorization" will make learners understand classification algorithms such as Minimum Distance to Mean (MDM) and Decision Tree (DT), clustering algorithms such as K-Means and DBSCAN with real-world examples. The sixth lecture "Hotspot Analysis" will introduce hotspot analysis and Getis-Ord GI* as the most popular method. The seventh lecture "Network Analysis" will make learners explore the algorithms of geocoding, map matching, and shortest path finding, of which importance is increasing in spatial big data analysis.
WEEK 6
Practical Applications of Spatial Data Science
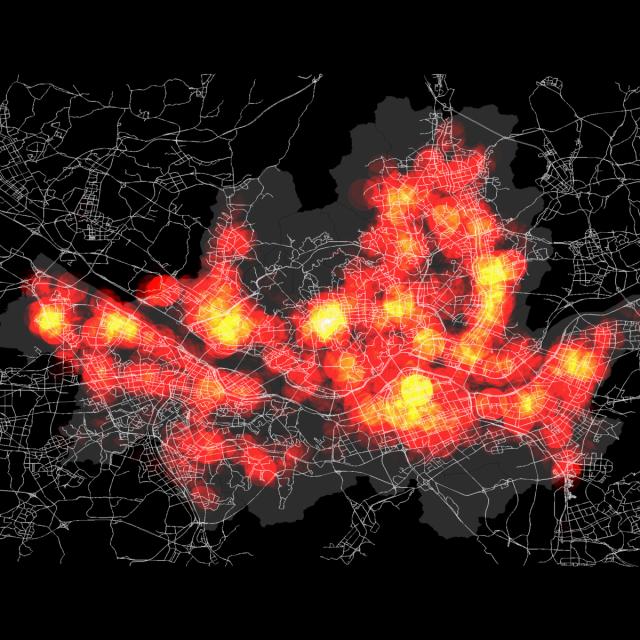
The sixth module is entitled to "Practical Applications of Spatial Data Science", in which five real-world problems are introduced and corresponding solutions are presented with step-by-step procedures in the solution structures and related open source software's, discussed in Module 2. The first lecture presents an example of Desktop GIS, in which only QGIS is used, to find the top 5 counties for timberland investment in the southeastern states of the U.S, in which simple differencing of demand and supply is applied to figure out counties of large deficit of timber supply in comparison with timber demand. In the second lecture, an example of sever GIS, in which QGIS and PostgreSQL/PostGIS are used, will be presented as a solution for a given problem of NYC spatial data center, which required multiple user access and different levels of privileges. The third lecture presents an example of spatial data analytics, in which QGIS and R are used, to find out any regional factors which contribute to higher or lower disease prevalence in administrative districts, for which spatial autocorrelation analysis is conducted and decision tree analysis is applied. The fourth lecture is another example of spatial data analytics, to find optimal infiltration routing with network analysis, in which cost surface is produced and Dijkstra's algorithm is used. The fifth lecture is an example of spatial big data management and analytics, in which QGIS, PostGIS, R, and Hadoop MapReduce are all used, to provide a solution of "Passenger Finder", which can guide to the places where more passengers are waiting for taxi cabs. For the solution, spatial big data, taxi trajectory, are collected, and noise removal and map matching are conducted in Hadoop environment. Then, a series of spatial data processing and analysis such as spatial join in PostGIS, hotspot analysis in R are conducted in order to provide the solution. All in all, learners will realize the value of spatial big data and power of the solution structure with combination of four disciplines.