Data Visualization for Genome Biology (Coursera)

Offered by University of Toronto,
Data Visualization for Genome Biology (Coursera)

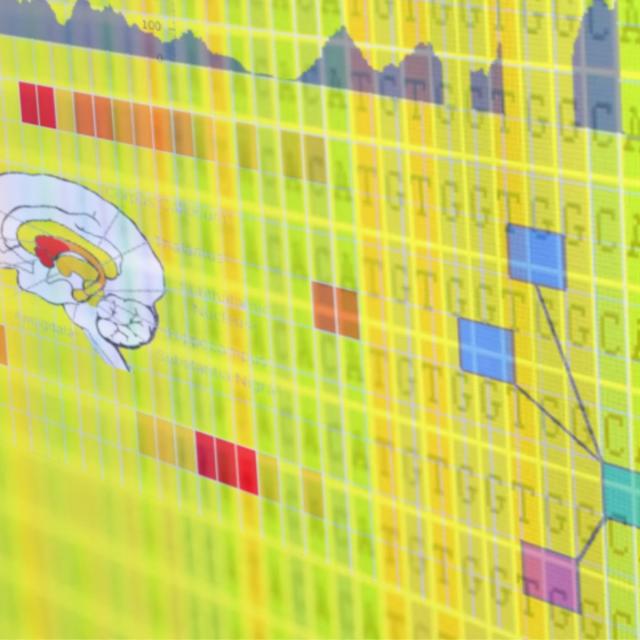
The past decade has seen a vast increase in the amount of data available to biologists, driven by the dramatic decrease in cost and concomitant rise in throughput of various next-generation sequencing technologies, such that a project unimaginable 10 years ago was recently proposed, the Earth BioGenomes Project, which aims to sequence the genomes of all eukaryotic species on the planet within the next 10 years. So while data are no longer limiting, accessing and interpreting those data has become a bottleneck. One important aspect of interpreting data is data visualization. This course introduces theoretical topics in data visualization through mini-lectures, and applied aspects in the form of hands-on labs.

Class Deals by MOOC List - Click here and see Coursera's Active Discounts, Deals, and Promo Codes.

The labs use both web-based tools and R, so students at all computer skill levels can benefit.

Syllabus

Week 1
In this module we'll cover 3 straightforward approaches for generating simple plots. As we'll see in the lab, often visualizing datasets can help us see the overall shape of the data that might not be captured in descriptive statistics like mean and standard deviation. Plotting datasets is also a useful way to identify outliers. In the mini-lectures we go over some common biological data visualization paradigms and more generally what the common chart types are, and we also talk about the context and grammar of data visualization.

Week 2
In this week's module we explore ways of displaying biological variation and a little bit of background about track viewers. We also cover visual perception, Gestalt principles, and issues related to colour perception, important for accessibility-related reasons. In the lab we'll use an online app, PlotsOfDifferences, to generate some charts that display variation nicely, and we'll also use R to generate some box plots, histograms, and violin plots. Last but not least, we'll try adjusting some of the settings in JBrowse to help assess gene expression levels in a more intuitive manner. Thanks to Dr. Joachim Goedhart, University of Amsterdam, Netherlands for permission to use PlotsOfDifferences in the lab.

Week 3
In this week's module we explore ways of visualizing gene expression data after briefly covering how we can measure gene expression levels with RNA-seq and identify significantly differentially expressed genes using statistical tests. We also cover design thinking. In the lab we'll use an online platform, Galaxy, to generate a volcano plot for visualizing significantly differentially expressed genes, and we'll also use R to generate some heatmaps of gene expression. Last but not least, we'll create our own "electronic fluorescent pictographs" for a gene expression data set.

Week 4
In this week's module we cover how the Gene Ontology can be used to make sense of often overwhelmingly long lists of genes from transcriptomic and other kind of 'omic experiments, especially through Gene Ontology enrichment analyses. We'll also look at Agile Development and User Testing and how these can help improve data visualization tools. In the lab, we'll try our hand at 3 online Gene Ontology analysis apps, and create some nice overview charts for GO enrichment results in R. Thanks to Dr. Roy Navon, Technion University, Israel, for permission to use GOrilla in the lab. Thanks to Dr. Juri Reimand of the University of Toronto for permission to use g:Profiler. And thanks to Dr. Zhen Su of the China Agricultural University for permission to use AgriGO.

Week 5
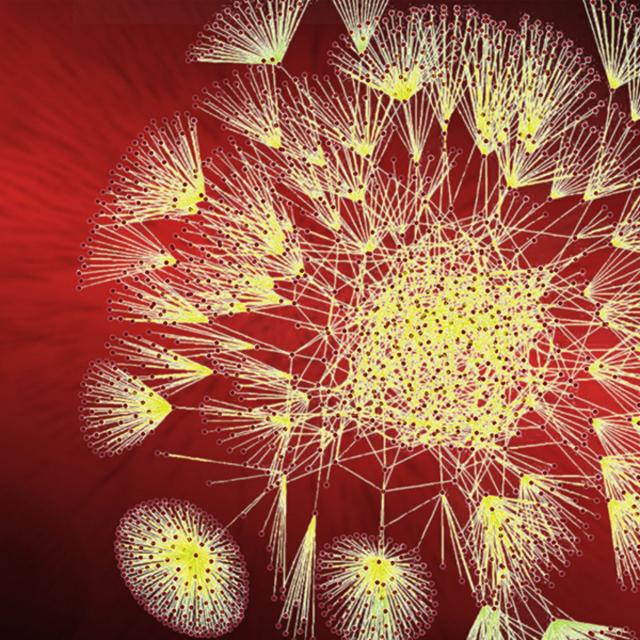
In this week's module, we explore tools for displaying and analyzing graph networks, notably those created when we generate protein-protein interactions, especially in a high-throughput manner. These PPIs are deposited in online databases like BioGRID, and can be retrieved on-the-fly via web services for display in powerful network visualization apps like Cytoscape. We'll talk about other web services/APIs that are available for biology in one of the mini-lectures, and in the lab we'll use Cytoscape to explore interactors of BRCA2. We'll also use a plug-in called BiNGO to do Gene Ontology enrichment analyses of its interactors, continuing our exploration of GO that we started last week. Last, we'll try using D3 to display an interaction network in a web page.

Week 6
In this module we cover methods for generating and making sense of ever bigger biological data sets. The growth in sequencing capacity has enabled projects that we unimaginable even a few years ago, such as the Earth Biogenomes Project, which aims to sequence the genome of a representative of every eukaryotic species on the planet. In order to make sense of these large data sets, it is often useful to use dimentionality reduction methods, like t-SNE, PCA, and UMAP, to help visualize how similar samples are. Logic diagrams (Venn-Euler or Upset plots) are also useful for displaying how sets of genes are similar one to another. Thanks to Dr. Tim Hulsen (Philips Research, the Netherlands) for permission to use the DeepVenn app in the lab.

Go to Class
MOOC List is learner-supported. When you buy through links on our site, we may earn an affiliate commission.

Related Courses

Interprofessional Healthcare Informatics (Coursera) Coursera
University of Minnesota

Interprofessional Healthcare Informatics (Coursera)

Interprofessional Healthcare Informatics is a graduate-level, hands-on interactive exploration of real informatics tools and techniques offered by the University of Minnesota and the University of Minnesota's National Center for Interprofessional Practice and Education. We will be incorporating technology-enabled educational innovations to bring the subject matter to life. Over the 10 modules, we will create a vital online learning community and a working healthcare informatics network.

Jun 22nd 2026
5-12 Weeks
Introduction to Genomic Technologies (Coursera) Coursera
Johns Hopkins University

Introduction to Genomic Technologies (Coursera)

This course introduces you to the basic biology of modern genomics and the experimental tools that we use to measure it. We'll introduce the Central Dogma of Molecular Biology and cover how next-generation sequencing can be used to measure DNA, RNA, and epigenetic patterns. You'll also get an introduction to the key concepts in computing and data science that you'll need to understand how data from next-generation sequencing experiments are generated and analyzed.

Jun 22nd 2026
4 Weeks
Mathematical Biostatistics Boot Camp 1 (Coursera) Coursera
Johns Hopkins University

Mathematical Biostatistics Boot Camp 1 (Coursera)

This class presents the fundamental probability and statistical concepts used in elementary data analysis. It will be taught at an introductory level for students with junior or senior college-level mathematical training including a working knowledge of calculus. A small amount of linear algebra and programming are useful for the class, but not required.

Jun 22nd 2026
4 Weeks
Pattern Discovery in Data Mining (Coursera) Coursera
University of Illinois at Urbana-Champaign

Pattern Discovery in Data Mining (Coursera)

Learn the general concepts of data mining along with basic methodologies and applications. Then dive into one subfield in data mining: pattern discovery. Learn in-depth concepts, methods, and applications of pattern discovery in data mining. We will also introduce methods for data-driven phrase mining and some interesting applications of pattern discovery. This course provides you the opportunity to learn skills and content to practice and engage in scalable pattern discovery methods on massive transactional data, discuss pattern evaluation measures, and study methods for mining diverse kinds of patterns, sequential patterns, and sub-graph patterns.

Jun 22nd 2026
4 Weeks
Practical Predictive Analytics: Models and Methods (Coursera) Coursera
University of Washington

Practical Predictive Analytics: Models and Methods (Coursera)

Statistical experiment design and analytics are at the heart of data science. In this course you will design statistical experiments and analyze the results using modern methods. You will also explore the common pitfalls in interpreting statistical arguments, especially those associated with big data. Collectively, this course will help you internalize a core set of practical and effective machine learning methods and concepts, and apply them to solve some real world problems.

Jun 22nd 2026
4 Weeks
Graph Analytics for Big Data (Coursera) Coursera
University of California, San Diego

Graph Analytics for Big Data (Coursera)

Want to understand your data network structure and how it changes under different conditions? Curious to know how to identify closely interacting clusters within a graph? Have you heard of the fast-growing area of graph analytics and want to learn more? This course gives you a broad overview of the field of graph analytics so you can learn new ways to model, store, retrieve and analyze graph-structured data.

Jun 22nd 2026
5-12 Weeks
Effective Problem-Solving and Decision-Making (Coursera) Coursera
University of California, Irvine

Effective Problem-Solving and Decision-Making (Coursera)

Critical thinking – the application of scientific methods and logical reasoning to problems and decisions – is the foundation of effective problem solving and decision making. Critical thinking enables us to avoid common obstacles, test our beliefs and assumptions, and correct distortions in our thought processes. Gain confidence in assessing problems accurately, evaluating alternative solutions, and anticipating likely risks. Learn how to use analysis, synthesis, and positive inquiry to address individual and organizational problems and develop the critical thinking skills needed in today’s turbulent times. Using case studies and situations encountered by class members, explore successful models and proven methods that are readily transferable on-the-job.

Jun 22nd 2026
4 Weeks
The Data Scientist's Toolbox (Coursera) Coursera
Johns Hopkins University

The Data Scientist's Toolbox (Coursera)

In this course you will get an introduction to the main tools and ideas in the data scientist's toolbox. The course gives an overview of the data, questions, and tools that data analysts and data scientists work with. There are two components to this course. The first is a conceptual introduction to the ideas behind turning data into actionable knowledge. The second is a practical introduction to the tools that will be used in the program like version control, markdown, git, GitHub, R, and RStudio.

Jun 22nd 2026
4 Weeks
Fundamentals of GIS (Coursera) Coursera
University of California, Davis

Fundamentals of GIS (Coursera)

Explore the world of spatial analysis and cartography with geographic information systems (GIS). What you will learn: define core geospatial concepts; practice with subset data using selections and feature attributes; create map books using advanced mapping techniques; create layer and map packages.

Jun 22nd 2026
4 Weeks
Leadership Through Marketing (Coursera) Coursera
Northwestern University

Leadership Through Marketing (Coursera)

The success of every organization depends on attracting and retaining customers. Although the marketing concepts for doing so are well established, digital technology has empowered customers, while producing massive amounts of data, revolutionizing the processes through which organizations attract and retain customers. In this course, students will learn how to identify new opportunities to create value for empowered consumers, develop strategies that yield an advantage over rivals, and develop the data science skills to lead more effectively, allocate resources, and to confront this very challenging environment with confidence.

Jun 28th 2026
4 Weeks
Data Manipulation at Scale: Systems and Algorithms (Coursera) Coursera
University of Washington

Data Manipulation at Scale: Systems and Algorithms (Coursera)

Data analysis has replaced data acquisition as the bottleneck to evidence-based decision making --- we are drowning in it. Extracting knowledge from large, heterogeneous, and noisy datasets requires not only powerful computing resources, but the programming abstractions to use them effectively. The abstractions that emerged in the last decade blend ideas from parallel databases, distributed systems, and programming languages to create a new class of scalable data analytics platforms that form the foundation for data science at realistic scales.

Jun 22nd 2026
4 Weeks