Data Visualization (Coursera)

Data Visualization (Coursera)

Learn the general concepts of data mining along with basic methodologies and applications. Then dive into one subfield in data mining: pattern discovery. Learn in-depth concepts, methods, and applications of pattern discovery in data mining. We will also introduce methods for pattern-based classification and some interesting applications of pattern discovery. This course provides you the opportunity to learn skills and content to practice and engage in scalable pattern discovery methods on massive transactional data, discuss pattern evaluation measures, and study methods for mining diverse kinds of patterns, sequential patterns, and sub-graph patterns.

Class Deals by MOOC List - Click here and see Coursera's Active Discounts, Deals, and Promo Codes.

This course is part of the Data Mining Specialization.

Syllabus

Course Orientation
You will become familiar with the course, your classmates, and our learning environment. The orientation will also help you obtain the technical skills required for the course.

Week 1: The Computer and the Human
In this week's module, you will learn what data visualization is, how it's used, and how computers display information. You'll also explore different types of visualization and how humans perceive information.

Week 2: Visualization of Numerical Data
In this week's module, you will start to think about how to visualize data effectively. This will include assigning data to appropriate chart elements, using glyphs, parallel coordinates, and streamgraphs, as well as implementing principles of design and color to make your visualizations more engaging and effective.

Week 3: Visualization of Non-Numerical Data
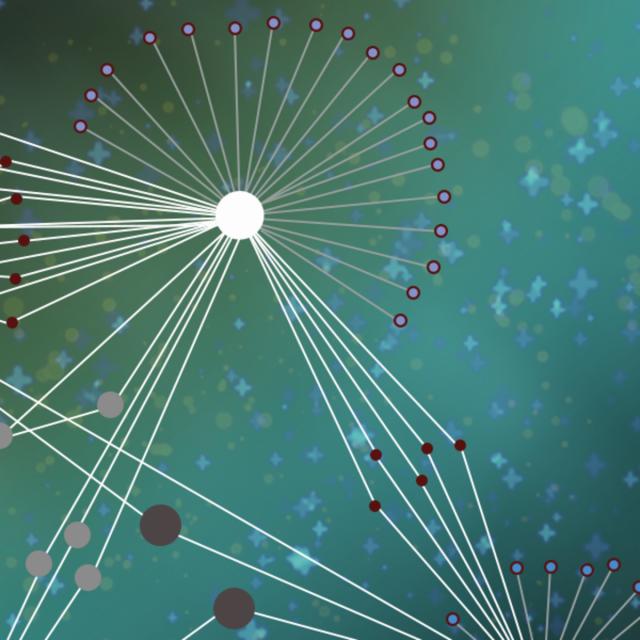
In this week's module, you will learn how to visualize graphs that depict relationships between data items. You'll also plot data using coordinates that are not specifically provided by the data set.

Week 4: The Visualization Dashboard
In this week's module, you will start to put together everything you've learned by designing your own visualization system for large datasets and dashboards. You'll create and interpret the visualization you created from your data set, and you'll also apply techniques from user-interface design to create an effective visualization system.

Go to Class
MOOC List is learner-supported. When you buy through links on our site, we may earn an affiliate commission.

Related Courses

Introduction to Clinical Data (Coursera) Coursera
Stanford University

Introduction to Clinical Data (Coursera)

This course introduces you to a framework for successful and ethical medical data mining. We will explore the variety of clinical data collected during the delivery of healthcare. You will learn to construct analysis-ready datasets and apply computational procedures to answer clinical questions. We will also explore issues of fairness and bias that may arise when we leverage healthcare data to make decisions about patient care.

Jun 22nd 2026
5-12 Weeks
Big Data Analytical Platform on Alibaba Cloud (Coursera) Coursera
Alibaba Cloud Academy

Big Data Analytical Platform on Alibaba Cloud (Coursera)

Building an Analytical Platform on Alibaba Cloud can empower how you take in, analyze, and demonstrate clear metrics from a set of Big Data. This course is designed to teach engineers how to use Alibaba Cloud Big Data products. It covers basic distributed system theory and Alibaba Cloud's core products like MaxCompute, DataWorks, E-MapReduce as well as a bundle of ecosystem tools.

Jun 22nd 2026
5-12 Weeks
Interprofessional Healthcare Informatics (Coursera) Coursera
University of Minnesota

Interprofessional Healthcare Informatics (Coursera)

Interprofessional Healthcare Informatics is a graduate-level, hands-on interactive exploration of real informatics tools and techniques offered by the University of Minnesota and the University of Minnesota's National Center for Interprofessional Practice and Education. We will be incorporating technology-enabled educational innovations to bring the subject matter to life. Over the 10 modules, we will create a vital online learning community and a working healthcare informatics network.

Jun 22nd 2026
5-12 Weeks
Data Analysis Using Python (Coursera) Coursera
University of Pennsylvania

Data Analysis Using Python (Coursera)

This course provides an introduction to basic data science techniques using Python. Students are introduced to core concepts like Data Frames and joining data, and learn how to use data analysis libraries like pandas, numpy, and matplotlib. This course provides an overview of loading, inspecting, and querying real-world data, and how to answer basic questions about that data. Students will gain skills in data aggregation and summarization, as well as basic data visualization.

Jun 22nd 2026
3 Weeks
Data Mining Methods (Coursera) Coursera
University of Colorado Boulder

Data Mining Methods (Coursera)

This course covers the core techniques used in data mining, including frequent pattern analysis, classification, clustering, outlier analysis, as well as mining complex data and research frontiers in the data mining field. Data Mining Methods can be taken for academic credit as part of CU Boulder’s Master of Science in Data Science (MS-DS) degree offered on the Coursera platform.

Jun 22nd 2026
4 Weeks
Data Analysis and Visualization (Coursera) Coursera
University at Buffalo,The State University of New York

Data Analysis and Visualization (Coursera)

By the end of this course, learners are provided a high-level overview of data analysis and visualization tools, and are prepared to discuss best practices and develop an ensuing action plan that addresses key discoveries. It begins with common hurdles that obstruct adoption of a data-driven culture before introducing data analysis tools (R software, Minitab, MATLAB, and Python). Deeper examination is spent on statistical process control (SPC), which is a method for studying variation over time. The course also addresses do’s and don’ts of presenting data visually, visualization software (Tableau, Excel, Power BI), and creating a data story.

Jun 22nd 2026
4 Weeks
Data Visualization with Advanced Excel (Coursera) Coursera
PwC

Data Visualization with Advanced Excel (Coursera)

In this course, you will get hands-on instruction of advanced Excel 2013 functions. You’ll learn to use PowerPivot to build databases and data models. We’ll show you how to perform different types of scenario and simulation analysis and you’ll have an opportunity to practice these skills by leveraging some of Excel's built in tools including, solver, data tables, scenario manager and goal seek.

Jun 22nd 2026
4 Weeks
Fundamentals of Machine Learning in Finance (Coursera) Coursera
New York University Tandon School of Engineering

Fundamentals of Machine Learning in Finance (Coursera)

The course aims at helping students to be able to solve practical ML-amenable problems that they may encounter in real life that include: (1) understanding where the problem one faces lands on a general landscape of available ML methods, (2) understanding which particular ML approach(es) would be most appropriate for resolving the problem, and (3) ability to successfully implement a solution, and assess its performance.

Jun 22nd 2026
4 Weeks
Excel Power Tools for Data Analysis (Coursera) Coursera
Macquarie University

Excel Power Tools for Data Analysis (Coursera)

Welcome to Excel Power Tools for Data Analysis. In this four-week course, we introduce Power Query, Power Pivot and Power BI, three power tools for transforming, analysing and presenting data. Excel's ease and flexibility have long made it a tool of choice for doing data analysis, but it does have some inherent limitations: for one, truly "big" data simply does not fit in a spreadsheet and for another, the process of importing and cleaning data can be a repetitive, time-consuming and error-prone.

Jun 22nd 2026
4 Weeks
Reports, Dashboards, and Customer Success in Salesforce (Coursera) Coursera
Salesforce,Pathstream

Reports, Dashboards, and Customer Success in Salesforce (Coursera)

The fourth course in the Salesforce Sales Operations Professional Certificate — Reports, Dashboards, and Customer Success in Salesforce — is for anyone who is curious about entry level sales roles that require foundational skills in Salesforce, the sales operations specialist role specifically, how to use tools in Salesforce to improve customer service at a business, how to leverage data in Salesforce to improve the overall performance of a sales team, and the path to becoming a Salesforce administrator.

Jun 22nd 2026
4 Weeks
Data Mining Project (Coursera) Coursera
University of Colorado Boulder

Data Mining Project (Coursera)

This course offers step-by-step guidance and hands-on experience of designing and implementing a real-world data mining project, including problem formulation, literature survey, proposed work, evaluation, discussion and future work. Data Mining Project can be taken for academic credit as part of CU Boulder’s Master of Science in Data Science (MS-DS) degree offered on the Coursera platform

Jun 22nd 2026
4 Weeks