Data Analysis Using Python (Coursera)

Data Analysis Using Python (Coursera)

This course provides an introduction to basic data science techniques using Python. Students are introduced to core concepts like Data Frames and joining data, and learn how to use data analysis libraries like pandas, numpy, and matplotlib. This course provides an overview of loading, inspecting, and querying real-world data, and how to answer basic questions about that data. Students will gain skills in data aggregation and summarization, as well as basic data visualization.

Class Deals by MOOC List - Click here and see Coursera's Active Discounts, Deals, and Promo Codes.

Course 2 of 4 in the Introduction to Programming with Python and Java Specialization.

What You Will Learn

  • Apply basic data science techniques using Python
  • Understand and apply core concepts like Data Frames and joining data, and use data analysis libraries like pandas, numpy, and matplotlib
  • Demonstrate how to load, inspect, and query real-world data, and answer basic questions about that data
  • Analyze data further by applying learned skills in data aggregation and summarization, as well as basic data visualization

Syllabus

WEEK 1
Loading, Querying, & Filtering Data Using the csv Module
This first module provides students with an overview of loading, inspecting, and exploring data using Python's simple csv library. To get started, this module includes a brief overview of Jupyter Notebook and a concise review of basic Python, including data structures, loops, and functions. This module showcases to the students an in-depth analysis of data stored in a .csv file, including basic querying, approaches for dealing with data errors, and how to filter and sort data based on a variety of criteria.

WEEK 2
Loading, Querying, Joining & Filtering Data Using pandas
In this module, students are introduced to core concepts like the Data Frame and joining data. Students will get experience using pandas, an industry-standard data analysis library, to load and query real-world data and to answer questions about that data. This module demonstrates how to do advanced filtering and indexing, slice subsets of data, restrict data attributes in query results, and do basic computations over the data. Includes how to build a simple recommendation system, and approaches for cleaning data, dealing with missing values, and creating new data.

WEEK 3
Summarizing & Visualizing Data
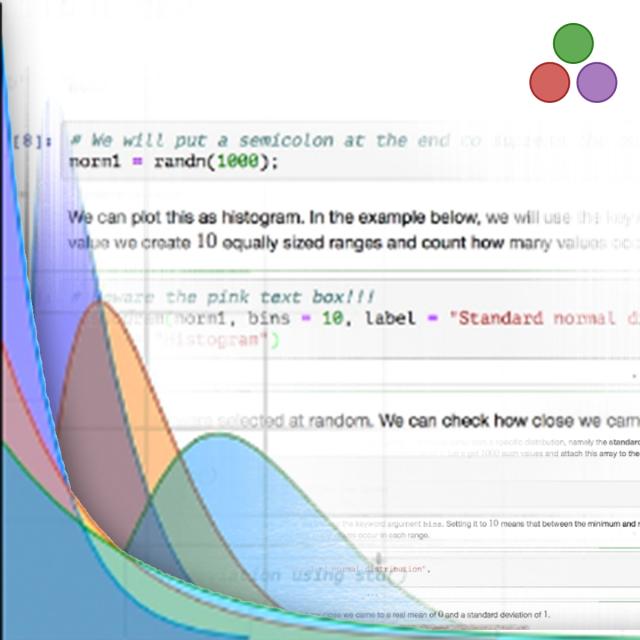
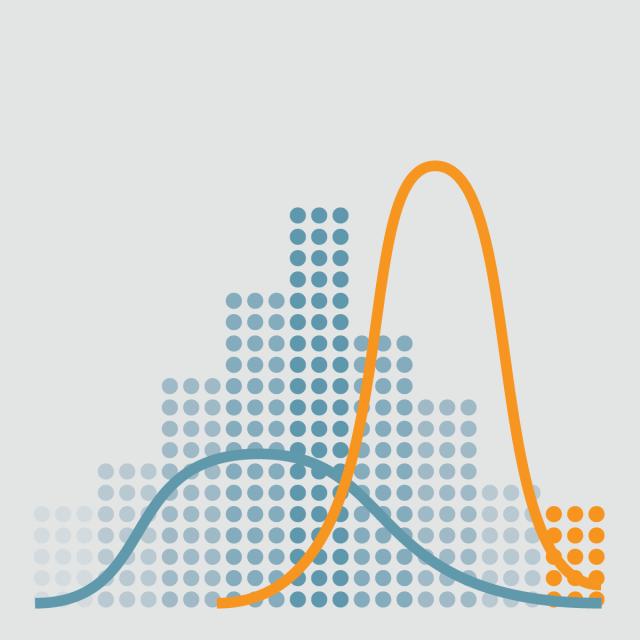
This module takes data analysis a step further by providing an overview of the process of aggregating, summarizing, and visualizing data. Students are introduced to the concept of grouping and indexing data, and how to display results in a pivot table using pandas. This module also demonstrates how to prepare and visualize data using a histogram and scatterplot in Jupyter Notebook. Students will gain skills in data aggregation and summarization, as well as basic data visualization. In addition, students will get experience using data analysis libraries like numpy and matplotlib.

Go to Class
MOOC List is learner-supported. When you buy through links on our site, we may earn an affiliate commission.

Related Courses

Business Intelligence Concepts, Tools, and Applications (Coursera) Coursera
University of Colorado System

Business Intelligence Concepts, Tools, and Applications (Coursera)

This is the fourth course in the Data Warehouse for Business Intelligence specialization. Ideally, the courses should be taken in sequence. In this course, you will gain the knowledge and skills for using data warehouses for business intelligence purposes and for working as a business intelligence developer. You’ll have the opportunity to work with large data sets in a data warehouse environment and will learn the use of MicroStrategy's Online Analytical Processing (OLAP) and Visualization capabilities to create visualizations and dashboards.

Jun 8th 2026
5-12 Weeks
Marketing Analytics (Coursera) Coursera
University of Virginia

Marketing Analytics (Coursera)

Organizations large and small are inundated with data about consumer choices. But that wealth of information does not always translate into better decisions. Knowing how to interpret data is the challenge -- and marketers in particular are increasingly expected to use analytics to inform and justify their decisions. Marketing analytics enables marketers to measure, manage and analyze marketing performance to maximize its effectiveness and optimize return on investment (ROI). Beyond the obvious sales and lead generation applications, marketing analytics can offer profound insights into customer preferences and trends, which can be further utilized for future marketing and business decisions.

Jun 8th 2026
5-12 Weeks
Framework for Data Collection and Analysis (Coursera) Coursera
University of Maryland, College Park

Framework for Data Collection and Analysis (Coursera)

This course will provide you with an overview over existing data products and a good understanding of the data collection landscape. With the help of various examples you will learn how to identify which data sources likely matches your research question, how to turn your research question into measurable pieces, and how to think about an analysis plan.

Jun 8th 2026
4 Weeks
Understanding China, 1700-2000: A Data Analytic Approach, Part 2 (Coursera) Coursera
The Hong Kong University of Science and Technology - HKUST

Understanding China, 1700-2000: A Data Analytic Approach, Part 2 (Coursera)

The purpose of this course is to summarize new directions in Chinese history and social science produced by the creation and analysis of big historical datasets based on newly opened Chinese archival holdings, and to organize this knowledge in a framework that encourages learning about China in comparative perspective. Our course demonstrates how a new scholarship of discovery is redefining what is singular about modern China and modern Chinese history.

Jun 8th 2026
4 Weeks
Regression Models (Coursera) Coursera
Johns Hopkins University

Regression Models (Coursera)

Linear models, as their name implies, relates an outcome to a set of predictors of interest using linear assumptions. Regression models, a subset of linear models, are the most important statistical analysis tool in a data scientist’s toolkit. This course covers regression analysis, least squares and inference using regression models.

Jun 8th 2026
4 Weeks
The Raspberry Pi Platform and Python Programming for the Raspberry Pi (Coursera) Coursera
University of California, Irvine

The Raspberry Pi Platform and Python Programming for the Raspberry Pi (Coursera)

The Raspberry Pi is a small, affordable single-board computer that you will use to design and develop fun and practical IoT devices while learning programming and computer hardware. In addition, you will learn how to set up up the Raspberry Pi environment, get a Linux operating system running, and write and execute some basic Python code on the Raspberry Pi. You will also learn how to use Python-based IDE (integrated development environments) for the Raspberry Pi and how to trace and debug Python code on the device.

Jun 8th 2026
4 Weeks
Graph Analytics for Big Data (Coursera) Coursera
University of California, San Diego

Graph Analytics for Big Data (Coursera)

Want to understand your data network structure and how it changes under different conditions? Curious to know how to identify closely interacting clusters within a graph? Have you heard of the fast-growing area of graph analytics and want to learn more? This course gives you a broad overview of the field of graph analytics so you can learn new ways to model, store, retrieve and analyze graph-structured data.

Jun 8th 2026
5-12 Weeks
Reproducible Research (Coursera) Coursera
Johns Hopkins University

Reproducible Research (Coursera)

This course focuses on the concepts and tools behind reporting modern data analyses in a reproducible manner. Reproducible research is the idea that data analyses, and more generally, scientific claims, are published with their data and software code so that others may verify the findings and build upon them. The need for reproducibility is increasing dramatically as data analyses become more complex, involving larger datasets and more sophisticated computations.

Jun 8th 2026
4 Weeks
Data Visualization (Coursera) Coursera
University of Illinois at Urbana-Champaign

Data Visualization (Coursera)

Learn the general concepts of data mining along with basic methodologies and applications. Then dive into one subfield in data mining: pattern discovery. Learn in-depth concepts, methods, and applications of pattern discovery in data mining. We will also introduce methods for pattern-based classification and some interesting applications of pattern discovery. This course provides you the opportunity to learn skills and content to practice and engage in scalable pattern discovery methods on massive transactional data, discuss pattern evaluation measures, and study methods for mining diverse kinds of patterns, sequential patterns, and sub-graph patterns.

Jun 8th 2026
4 Weeks
Introduction to Machine Learning (Coursera) Coursera
Duke University

Introduction to Machine Learning (Coursera)

This course will provide you a foundational understanding of machine learning models (logistic regression, multilayer perceptrons, convolutional neural networks, natural language processing, etc.) as well as demonstrate how these models can solve complex problems in a variety of industries, from medical diagnostics to image recognition to text prediction.

Jun 12th 2026
5-12 Weeks
Data Manipulation at Scale: Systems and Algorithms (Coursera) Coursera
University of Washington

Data Manipulation at Scale: Systems and Algorithms (Coursera)

Data analysis has replaced data acquisition as the bottleneck to evidence-based decision making --- we are drowning in it. Extracting knowledge from large, heterogeneous, and noisy datasets requires not only powerful computing resources, but the programming abstractions to use them effectively. The abstractions that emerged in the last decade blend ideas from parallel databases, distributed systems, and programming languages to create a new class of scalable data analytics platforms that form the foundation for data science at realistic scales.

Jun 8th 2026
4 Weeks