Business Analytics Using Forecasting (FutureLearn)

Business Analytics Using Forecasting (FutureLearn)

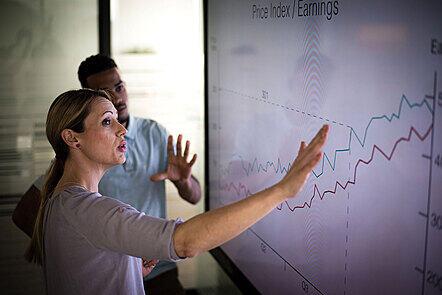
Discover how business can harness the power of big data to make better predictive analysis. Learn how to use data to create powerful business forecasts. Organisations currently collect a vast quantity of data about suppliers, clients, employees, citizens, transactions, and much more. However, many are unaware of the predictive power this ‘big data’ has if anaylsed correctly. On this course, you’ll learn about forecasting using big data, exploring how it’s used by business as an important component of decision making.

Class Deals by MOOC List - Click here and see FutureLearn's Active Discounts, Deals, and Promo Codes.

You’ll examine how to define a forecasting task and workflow. You’ll understand how to evaluate forecasting performance, analysing different forecasting methods. Ultimately, you’ll be able to implement your own practical forecasting process.

What topics will you cover?

  • Goal definitions
  • Data visualisation
  • Data modeling
  • Performance evaluation
  • Model deployment

What will you achieve?
By the end of the course, you‘ll be able to...

  • Describe business challenges and opportunities that call for forecasting
  • Evaluate performance of a forecasting solution
  • Apply and be familiar with popular forecasting methods
  • Explore, identify and model different types of patterns in time series
  • Develop a forecasting solution using forecasting methods

Who is the course for?
This course is for anyone who wants to understand how big data can help their business or organisation’s decision-making process. You will need to be familiar with basic statistical methods, including linear regression, as well as have basic knowledge of Excel and R software.

Go to Class
MOOC List is learner-supported. When you buy through links on our site, we may earn an affiliate commission.

Related Courses

Data Visualisation: Creating Charts and Complex Visualisations in Tableau (FutureLearn) FutureLearn
FutureLearn

Data Visualisation: Creating Charts and Complex Visualisations in Tableau (FutureLearn)

Learn the fundamentals of data visualisation and storytelling to boost your career options. Struggling to turn data insights into action within your organisation? Learn how to identify the right metrics to add to data dashboards and identify the most effective components to help you tell data stories through beautiful visualisations. This course will take you from theory into practice. You’ll build the skills you need to create interactive dashboards using Tableau.

May 23rd 2022
4 Weeks
Data Visualization (Coursera) Coursera
University of Illinois at Urbana-Champaign

Data Visualization (Coursera)

Learn the general concepts of data mining along with basic methodologies and applications. Then dive into one subfield in data mining: pattern discovery. Learn in-depth concepts, methods, and applications of pattern discovery in data mining. We will also introduce methods for pattern-based classification and some interesting applications of pattern discovery. This course provides you the opportunity to learn skills and content to practice and engage in scalable pattern discovery methods on massive transactional data, discuss pattern evaluation measures, and study methods for mining diverse kinds of patterns, sequential patterns, and sub-graph patterns.

Jun 22nd 2026
4 Weeks
Graph Analytics for Big Data (Coursera) Coursera
University of California, San Diego

Graph Analytics for Big Data (Coursera)

Want to understand your data network structure and how it changes under different conditions? Curious to know how to identify closely interacting clusters within a graph? Have you heard of the fast-growing area of graph analytics and want to learn more? This course gives you a broad overview of the field of graph analytics so you can learn new ways to model, store, retrieve and analyze graph-structured data.

Jun 22nd 2026
5-12 Weeks
Big Data: Data Visualisation (FutureLearn) FutureLearn
Queensland University of Technology

Big Data: Data Visualisation (FutureLearn)

Data visualisation is vital in bridging the gap between data and decisions. Discover the methods, tools and processes involved. Data visualisation is an important visual method for effective communication and analysing large datasets. Through data visualisations we are able to draw conclusions from data that sometimes are not immediately obvious, and interact with the data in an entirely different way.

No sessions Available
3 Weeks
Data Visualisation: Data Dashboards and Storytelling with Tableau (FutureLearn) FutureLearn
FutureLearn

Data Visualisation: Data Dashboards and Storytelling with Tableau (FutureLearn)

Learn the techniques that underpin predictive data analytics and understand the ethics behind them. Do you want to bring your predictive models to life and communicate with a diverse audience? Data visualisation is a great tool for predictive analysis and bringing statistical models to life within your organisation. You’ll learn how to use your data to make business predictions and get to grips with the ethical issues that can arise in the process. On this course, you’ll explore statistical techniques and the importance of testing and refining the models that you use for data analysis.

May 23rd 2022
4 Weeks
Data Visualisation with Python: Matplotlib and Visual Analysis (FutureLearn) FutureLearn
FutureLearn

Data Visualisation with Python: Matplotlib and Visual Analysis (FutureLearn)

Discover how to produce visual data analytics and business insights with the powerful Python programming language. Learn how to use Python for business analysis. Many organisations can collect and analyse data effectively, but not all are able to transform these insights into effective decision-making that results in organisational value. That’s where data visualisation comes in. This Python online course will supercharge your data visualisation skills for both exploratory and explanatory purposes, using the commonly used programming language.

May 30th 2022
4 Weeks
Big Data Analytics: Opportunities, Challenges and the Future (FutureLearn) FutureLearn
Griffith University

Big Data Analytics: Opportunities, Challenges and the Future (FutureLearn)

We produce more data than ever before. Find out how ‘big data analytics’ can help you make use of it. In the information age, we value the people who can understand the data. Put simply, ‘big data analytics’ helps us to understand the huge volume of information our world now generates. We can use analytics to uncover hidden patterns, predict trends, gauge customer opinions and so much more.

Available now
2 Weeks
Data Visualisation with Python: Bokeh and Advanced Layouts (FutureLearn) FutureLearn
FutureLearn

Data Visualisation with Python: Bokeh and Advanced Layouts (FutureLearn)

Elevate your data visualisation skills and better communicate your data insights with the data visualisation package, Bokeh. Learn how to use Bokeh in Python. On the first week of the course, you’ll explore the key functions of Bokeh and how it can be used to create interactive visualisations and dashboards.

May 30th 2022
4 Weeks
Fundamentals of GIS (Coursera) Coursera
University of California, Davis

Fundamentals of GIS (Coursera)

Explore the world of spatial analysis and cartography with geographic information systems (GIS). What you will learn: define core geospatial concepts; practice with subset data using selections and feature attributes; create map books using advanced mapping techniques; create layer and map packages.

Jun 22nd 2026
4 Weeks