Big Data: Data Visualisation (FutureLearn)

Big Data: Data Visualisation (FutureLearn)

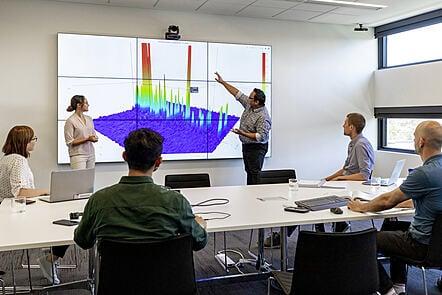
Data visualisation is vital in bridging the gap between data and decisions. Discover the methods, tools and processes involved. Data visualisation is an important visual method for effective communication and analysing large datasets. Through data visualisations we are able to draw conclusions from data that sometimes are not immediately obvious, and interact with the data in an entirely different way.

Class Deals by MOOC List - Click here and see FutureLearn's Active Discounts, Deals, and Promo Codes.

This course will provide you with an informative introduction to the methods, tools and processes involved in visualising big data. We will also take the time to examine briefly the use of visualisation throughout history dating back as far as 17000 BC.

What topics will you cover?

  • Introduction to visualisation
  • Information visualisation
  • Scientific visualisation
  • Visualisation tools
  • Design approaches for visualisation
  • Visualisation for communication

What will you achieve?
By the end of the course, you'll be able to...

  • Explore big data frameworks
  • Demonstrate an integrated approach to big data
  • Develop an awareness of how to participate effectively in a team working with big data experts

What software or tools do you need?
We will use a variety of tools so that you become comfortable engaging with different software and confident trialing new packages to find those that best meet your needs. Please review the product websites below to ensure your system meets the minimum requirements for the tools we will be using.
Tableau: You can use the free trial for a period of 2 weeks. Please do not start the trial until you are ready to do the Tableau exercises.
MATLAB Online: MathWorks will provide you with a license to use MATLAB online for the duration of the course.
D3.js: The D3 JavaScript library is available under BSD license.
You can still learn effectively even if you don’t have access to all of these tools as you will be able to see what they can do for you.

Go to Class
MOOC List is learner-supported. When you buy through links on our site, we may earn an affiliate commission.

Related Courses

Communicating Data Science Results (Coursera) Coursera
University of Washington

Communicating Data Science Results (Coursera)

Making predictions is not enough! Effective data scientists know how to explain and interpret their results, and communicate findings accurately to stakeholders to inform business decisions. Visualization is the field of research in computer science that studies effective communication of quantitative results by linking perception, cognition, and algorithms to exploit the enormous bandwidth of the human visual cortex. In this course you will learn to recognize, design, and use effective visualizations.

Jun 22nd 2026
3 Weeks
Predictive Analytics: Solving Business Problems Using Machine Learning and Big Data (FutureLearn) FutureLearn
Sungkyunkwan University - SKKU

Predictive Analytics: Solving Business Problems Using Machine Learning and Big Data (FutureLearn)

Explore how predictive models can help businesses use data to identify risks and discover new opportunities. Discover how predictive analytics could transform your business As businesses accrue more and more data about their customers – from their behavioural history to their transactions – being able to use ‘Big Data’ is becoming increasingly key to low-term business success.

Aug 16th 2021
4 Weeks
Data Visualisation with Tableau Fundamentals (FutureLearn) FutureLearn
FutureLearn

Data Visualisation with Tableau Fundamentals (FutureLearn)

Learn the fundamentals of data visualisation – from core components to interactive elements. Want to create meaningful data visualisations that fuel decision-making and growth within your business? This course teaches you the basics – from individual elements and relationships through to data preparation in Tableau. You’ll learn design theories and how to identify important dashboard elements before moving on to hands-on exercises.

May 23rd 2022
4 Weeks
Big Data, Genes, and Medicine (Coursera) Coursera
The State University of New York

Big Data, Genes, and Medicine (Coursera)

This course distills for you expert knowledge and skills mastered by professionals in Health Big Data Science and Bioinformatics. You will learn exciting facts about the human body biology and chemistry, genetics, and medicine that will be intertwined with the science of Big Data and skills to harness the avalanche of data openly available at your fingertips and which we are just starting to make sense of.

Jun 22nd 2026
5-12 Weeks
Big Data and the Environment (FutureLearn) FutureLearn
University of Reading,Institute for Environmental Analytics - IEA

Big Data and the Environment (FutureLearn)

From sources such as satellites, sensors and social media, how can environmental data analytics benefit business and research? From weather fluctuations to the spread of an invasive species, what problems can scientists address by analysing these vast data collections? What are the potential benefits for business, research and our daily lives?

No sessions available
3 Weeks
The Importance of Listening (Coursera) Coursera
Northwestern University

The Importance of Listening (Coursera)

In this second MOOC in the Social Marketing Specialization - "The Importance of Listening" - you will go deep into the Big Data of social and gain a more complete picture of what can be learned from interactions on social sites. You will be amazed at just how much information can be extracted from a single post, picture, or video.

Jun 22nd 2026
4 Weeks
Managing Big Data with R and Hadoop (FutureLearn) FutureLearn
Partnership for Advanced Computing in Europe - PRACE

Managing Big Data with R and Hadoop (FutureLearn)

Learn how to manage and analyse big data using the R programming language and Hadoop programming framework. This course will give you access to a virtual environment with installations of Hadoop, R and Rstudio to get hands-on experience with big data management. Several unique examples from statistical learning and related R code for map-reduce operations will be available for testing and learning.

Apr 3rd 2023
5-12 Weeks
Data Visualisation: Data Dashboards and Storytelling with Tableau (FutureLearn) FutureLearn
FutureLearn

Data Visualisation: Data Dashboards and Storytelling with Tableau (FutureLearn)

Learn the techniques that underpin predictive data analytics and understand the ethics behind them. Do you want to bring your predictive models to life and communicate with a diverse audience? Data visualisation is a great tool for predictive analysis and bringing statistical models to life within your organisation. You’ll learn how to use your data to make business predictions and get to grips with the ethical issues that can arise in the process. On this course, you’ll explore statistical techniques and the importance of testing and refining the models that you use for data analysis.

May 23rd 2022
4 Weeks
Julia Scientific Programming (Coursera) Coursera
University of Cape Town

Julia Scientific Programming (Coursera)

This four-module course introduces users to Julia as a first language. Julia is a high-level, high-performance dynamic programming language developed specifically for scientific computing. This language will be particularly useful for applications in physics, chemistry, astronomy, engineering, data science, bioinformatics and many more.

Jun 22nd 2026
4 Weeks
Fundamentals of GIS (Coursera) Coursera
University of California, Davis

Fundamentals of GIS (Coursera)

Explore the world of spatial analysis and cartography with geographic information systems (GIS). What you will learn: define core geospatial concepts; practice with subset data using selections and feature attributes; create map books using advanced mapping techniques; create layer and map packages.

Jun 22nd 2026
4 Weeks
Managing Big Data with MySQL (Coursera) Coursera
Duke University

Managing Big Data with MySQL (Coursera)

This course is an introduction to how to use relational databases in business analysis. You will learn how relational databases work, and how to use entity-relationship diagrams to display the structure of the data held within them. This knowledge will help you understand how data needs to be collected in business contexts, and help you identify features you want to consider if you are involved in implementing new data collection efforts.

Jun 22nd 2026
5-12 Weeks