Reports

Filter Courses within "Reports" (Click to filter)
Reports, Dashboards, and Customer Success in Salesforce (Coursera) Coursera
Salesforce,Pathstream

Reports, Dashboards, and Customer Success in Salesforce (Coursera)

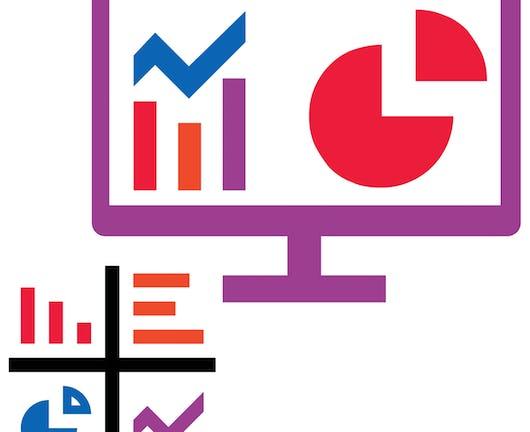
Dive into 'Reports, Dashboards, and Customer Success in Salesforce', a crucial course for anyone looking to harness the power of Salesforce for better reporting, dashboard creation, and enhancing customer success strategies. This course is part of Coursera's Salesforce Sales Operations Professional Certificate program, aimed at those interested in foundational sales roles that leverage Salesforce effectively. Discover how to use Salesforce tools to improve customer service, analyze data for sales team performance enhancement, and prepare yourself for a career path towards becoming a Salesforce administrator.

Jun 22nd 2026
4 Weeks
Decisions, Decisions: Dashboards and Reports (Coursera) Coursera
Google

Decisions, Decisions: Dashboards and Reports (Coursera)

In this final course of the Google Business Intelligence Certificate program, you'll dive deep into dashboard creation and report designing. Gain expertise in planning and crafting BI visuals, and learn to build interactive dashboards that provide long-term data monitoring capabilities. Perfect for professionals aiming to enhance their analytical skills and contribute more effectively to business decision-making processes.

Jun 15th 2026
5-12 Weeks
Data Analysis and Visualization with Power BI (Coursera) Coursera
Microsoft

Data Analysis and Visualization with Power BI (Coursera)

Embark on a journey into data analysis and visualization mastery with this engaging course on Power BI. Designed for beginners and professionals alike, you'll learn how to transform raw data into insightful, visually appealing reports and dashboards that can drive informed decision-making within your organization.

Jun 15th 2026
5-12 Weeks
Creative Designing in Power BI (Coursera) Coursera
Microsoft

Creative Designing in Power BI (Coursera)

Embark on an exciting journey into the world of data visualization with 'Creative Designing in Power BI'. This course is designed for aspiring and professional data analysts who wish to enhance their skills in creating intuitive and visually appealing dashboards, reports, and charts. Master the art of storytelling through data using Microsoft's leading analytics platform.

Jun 15th 2026
4 Weeks
Page 1