Charts

Filter Courses within "Charts" (Click to filter)
Business intelligence and data analytics: Generate insights (Coursera) Coursera
Macquarie University
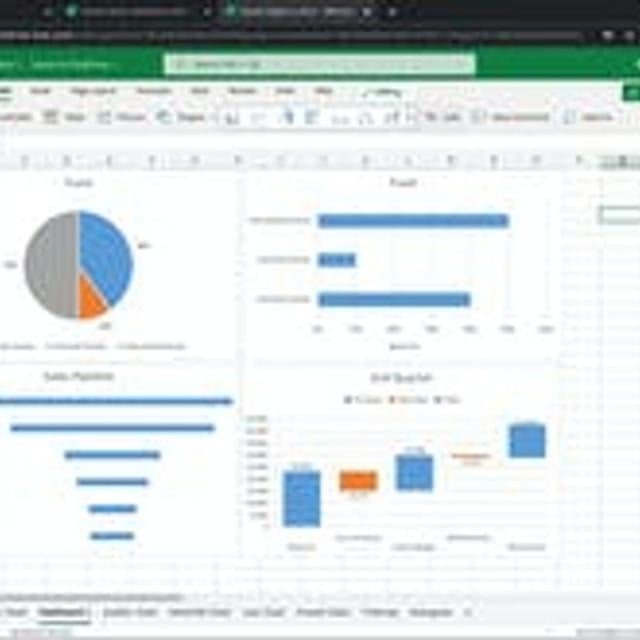
Business intelligence and data analytics: Generate insights (Coursera)

Discover the secrets to understanding and leveraging 'megatrends' that shape today's business landscape. This course will equip you with essential data analytics tools and skills to analyze challenges and opportunities, ensuring your organization stays ahead of the curve. Perfect for professionals looking to make informed decisions based on data insights.

Jun 1st 2026
5-12 Weeks
Google Sheets - Advanced Topics (Coursera) Coursera
Google Cloud

Google Sheets - Advanced Topics (Coursera)

Expand your knowledge of Google Sheets by diving into its most powerful features. This course will guide you through advanced topics such as applying and customizing themes, mastering conditional formatting, using complex formulas, referencing data, and validating information in a Google Sheet. Whether you're a business professional, educator, or data enthusiast, this course will equip you with the skills to take your spreadsheet capabilities to the next level.

Jun 1st 2026
1 Week
Visualização de dados com o Python (Coursera) Coursera
IBM

Visualização de dados com o Python (Coursera)

Este curso introdutório sobre Visualização de Dados com Python ensina os fundamentos essenciais para transformar complexidades em gráficos claros. Aprenda a usar o poder do Python para criar representações visuais que facilitam a compreensão e comunicação de insights cruciais, tornando-se um especialista na interpretação e apresentação de dados.

Sep 11th 2023
3 Weeks
Data Visualisation: Creating Charts and Complex Visualisations in Tableau (FutureLearn) FutureLearn
FutureLearn

Data Visualisation: Creating Charts and Complex Visualisations in Tableau (FutureLearn)

Discover the power of storytelling through data with our Data Visualisation course. Whether you're a beginner or looking to refine your skills, this FutureLearn program will equip you with the tools to transform complex datasets into clear and compelling visual narratives using Tableau. Learn how to identify key metrics, design effective dashboards, and create interactive visualizations that drive decision-making.

May 23rd 2022
4 Weeks
Data Visualisation with Tableau Fundamentals (FutureLearn) FutureLearn
FutureLearn

Data Visualisation with Tableau Fundamentals (FutureLearn)

Discover the art and science of data visualization with this beginner-friendly course on FutureLearn. Learn to prepare, analyze, and present your data effectively using Tableau's powerful tools. From understanding core concepts to crafting interactive dashboards, you'll gain skills that are crucial for modern data professionals looking to make an impact.

May 23rd 2022
4 Weeks
Excel Basics for Data Visualizations (Coursera) Coursera
Coursera Project Network

Excel Basics for Data Visualizations (Coursera)

Unlock the power of Excel spreadsheets by learning the fundamentals of data visualization. This course will guide you through creating various charts and graphs, building interactive dashboards, and understanding the importance of storytelling with data. Perfect for beginners looking to start their journey into data analysis and visualization.

Mar 7th 2022
Self-Paced
Interpreting Japanese Candlestick Charts (Fx Academy) FX Academy
FX Academy

Interpreting Japanese Candlestick Charts (Fx Academy)

Discover the art of technical analysis with our comprehensive 'Interpreting Japanese Candlestick Charts' course by Fx Academy. Whether you're a novice trader or looking to refine your skills, this course provides essential tools for understanding market behavior and making strategic trading decisions. Learn how to read candlesticks, set up effective reward/risk ratios, and master the concepts of support and resistance.

Self Paced
Self-Paced