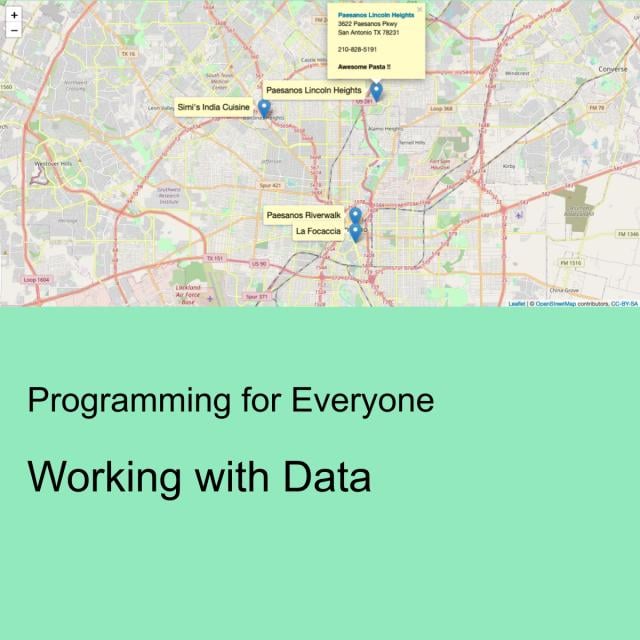
In this 3rd Guided Project in the "Programming for Everyone" series, we will learn how to work with data. We will learn about the dplyr package and how to use it to process data. We will subsequently update the app that we created in the 2nd Guided Project in this "Programming for Everyone" series to add support for multiple cities. Finally, we will see how to create tabular graphics with data using the "gt" package.
Class Deals by MOOC List - Click here and see Coursera's Active Discounts, Deals, and Promo Codes.
In this Guided Project, you will:
- Learn how to organize data using dataframes and process data in a dataframe.
- Use dplyr package to process data in dataframes
- Learn about Shiny App Layout and Shiny Widgets
Learn step-by-step
- Guided Project Introduction
- Introduction to Dataframes in R
- Working with Dataframes
- Using dplyr Package for processing data
- Web App Layouts in Shiny
- Adding a drop down
- Update Server Function
- Deploying our App
- Additional Material and Wrapu
Go to Class
MOOC List is learner-supported. When you buy through links on our site, we may earn an affiliate commission.