Impress your boss and co-workers with your beautiful and very useful graphs. Follow along - step by step. I used to be an accountant and financial controller and I made beautiful graphs all the time. The board of directors used to think I was a genius, but actually they are very easy to do once you know how.
The course covers:
- Creating the data table
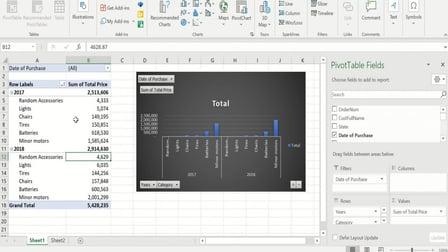
- Let's create our first graph
- All the chart elements
- Why the gridlines are crucial
- Bring to life with color
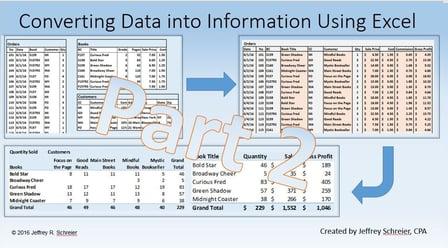
- How to select and move data
- Line charts, stacked charts by area, stacked bar, and pie chart part 1 - formatting
- Pie chart part 2 and linking data
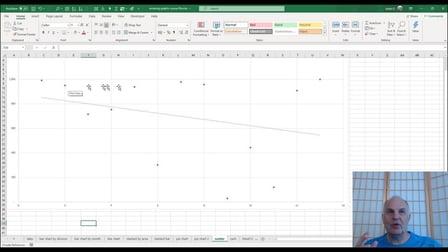
- Trendlines and scatter graphs
- Combo charts and the secondary axis
- Gantt charts
Go to Class
MOOC List is learner-supported. When you buy through links on our site, we may earn an affiliate commission.