Data Science in Real Life (Coursera)

Data Science in Real Life (Coursera)

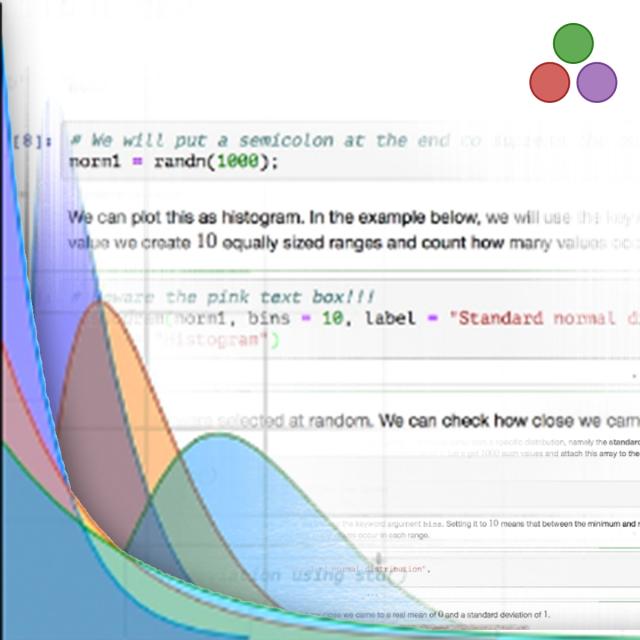
Have you ever had the perfect data science experience? The data pull went perfectly. There were no merging errors or missing data. Hypotheses were clearly defined prior to analyses. Randomization was performed for the treatment of interest. The analytic plan was outlined prior to analysis and followed exactly. The conclusions were clear and actionable decisions were obvious. Has that every happened to you? Of course not. Data analysis in real life is messy. How does one manage a team facing real data analyses? In this one-week course, we contrast the ideal with what happens in real life. By contrasting the ideal, you will learn key concepts that will help you manage real life analyses.

Class Deals by MOOC List - Click here and see Coursera's Active Discounts, Deals, and Promo Codes.

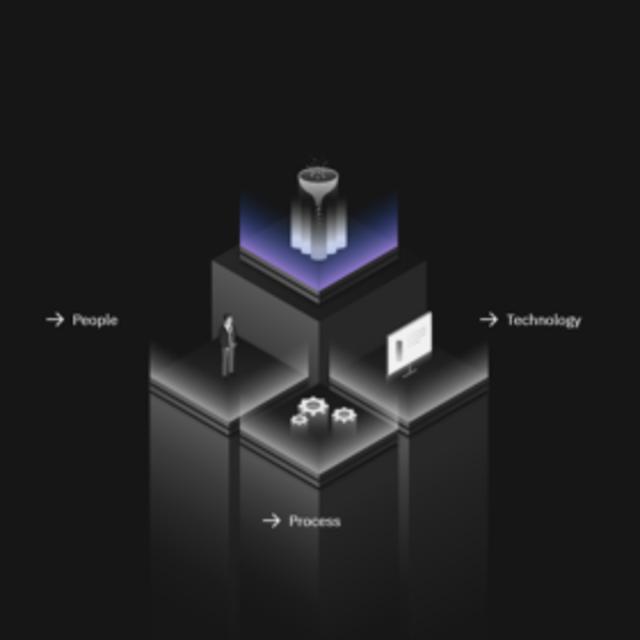
This is a focused course designed to rapidly get you up to speed on doing data science in real life. Our goal was to make this as convenient as possible for you without sacrificing any essential content. We've left the technical information aside so that you can focus on managing your team and moving it forward.
Course 4 of 5 in the Executive Data Science Specialization.
After completing this course you will know how to:

  1. Describe the “perfect” data science experience
  2. Identify strengths and weaknesses in experimental designs
  3. Describe possible pitfalls when pulling / assembling data and learn solutions for managing data pulls.
  4. Challenge statistical modeling assumptions and drive feedback to data analysts
  5. Describe common pitfalls in communicating data analyses
  6. Get a glimpse into a day in the life of a data analysis manager.

The course will be taught at a conceptual level for active managers of data scientists and statisticians. Some key concepts being discussed include:

  1. Experimental design, randomization, A/B testing
  2. Causal inference, counterfactuals,
  3. Strategies for managing data quality.
  4. Bias and confounding
  5. Contrasting machine learning versus classical statistical inference

What You Will Learn

  • Identify strengths and weaknesses in experimental designs
  • Learn novel solutions for managing data pulls
  • Describe common pitfalls in communicating data analyses
  • Understand a typical day in the life of a data analysis manager

Syllabus

WEEK 1
Introduction, the perfect data science experience
This course is one module, intended to be taken in one week. Please do the course roughly in the order presented. Each lecture has reading and videos. Except for the introductory lecture, every lecture has a 5 question quiz; get 4 out of 5 or better on the quiz.

Go to Class
MOOC List is learner-supported. When you buy through links on our site, we may earn an affiliate commission.

Related Courses

Machine Learning: Classification (Coursera) Coursera
University of Washington

Machine Learning: Classification (Coursera)

Case Studies: Analyzing Sentiment & Loan Default Prediction. In our case study on analyzing sentiment, you will create models that predict a class (positive/negative sentiment) from input features (text of the reviews, user profile information,...). In our second case study for this course, loan default prediction, you will tackle financial data, and predict when a loan is likely to be risky or safe for the bank.

Jun 8th 2026
5-12 Weeks
Infonomics II: Business Information Management and Measurement (Coursera) Coursera
University of Illinois at Urbana-Champaign

Infonomics II: Business Information Management and Measurement (Coursera)

Even decades into the Information Age, accounting practices yet fail to recognize the financial value of information. Moreover, traditional asset management practices fail to recognize information as an asset to be managed with earnest discipline. This has led to a business culture of complacence, and the inability for most organizations to fully leverage available information assets. This second course in the two-part Infonomics series explores how and why to adapt well-honed asset management principles and practices to information, and how to apply accepted and new valuation models to gauge information’s potential and realized economic benefits.

Jun 10th 2026
4 Weeks
Understanding China, 1700-2000: A Data Analytic Approach, Part 1 (Coursera) Coursera
The Hong Kong University of Science and Technology - HKUST

Understanding China, 1700-2000: A Data Analytic Approach, Part 1 (Coursera)

The purpose of this course is to summarize new directions in Chinese history and social science produced by the creation and analysis of big historical datasets based on newly opened Chinese archival holdings, and to organize this knowledge in a framework that encourages learning about China in comparative perspective. Our course demonstrates how a new scholarship of discovery is redefining what is singular about modern China and modern Chinese history.

Jun 8th 2026
5-12 Weeks
Marketing Analytics (Coursera) Coursera
University of Virginia

Marketing Analytics (Coursera)

Organizations large and small are inundated with data about consumer choices. But that wealth of information does not always translate into better decisions. Knowing how to interpret data is the challenge -- and marketers in particular are increasingly expected to use analytics to inform and justify their decisions. Marketing analytics enables marketers to measure, manage and analyze marketing performance to maximize its effectiveness and optimize return on investment (ROI). Beyond the obvious sales and lead generation applications, marketing analytics can offer profound insights into customer preferences and trends, which can be further utilized for future marketing and business decisions.

Jun 8th 2026
5-12 Weeks
Introduction to Spreadsheets and Models (Coursera) Coursera
University of Pennsylvania

Introduction to Spreadsheets and Models (Coursera)

The simple spreadsheet is one of the most powerful data analysis tools that exists, and it’s available to almost anyone. Major corporations and small businesses alike use spreadsheet models to determine where key measures of their success are now, and where they are likely to be in the future. But in order to get the most out of a spreadsheet, you have know how to use it. This course is designed to give you an introduction to basic spreadsheet tools and formulas so that you can begin harness the power of spreadsheets to map the data you have now and to predict the data you may have in the future.

Jun 8th 2026
4 Weeks
Reproducible Research (Coursera) Coursera
Johns Hopkins University

Reproducible Research (Coursera)

This course focuses on the concepts and tools behind reporting modern data analyses in a reproducible manner. Reproducible research is the idea that data analyses, and more generally, scientific claims, are published with their data and software code so that others may verify the findings and build upon them. The need for reproducibility is increasing dramatically as data analyses become more complex, involving larger datasets and more sophisticated computations.

Jun 8th 2026
4 Weeks
Leadership Through Marketing (Coursera) Coursera
Northwestern University

Leadership Through Marketing (Coursera)

The success of every organization depends on attracting and retaining customers. Although the marketing concepts for doing so are well established, digital technology has empowered customers, while producing massive amounts of data, revolutionizing the processes through which organizations attract and retain customers. In this course, students will learn how to identify new opportunities to create value for empowered consumers, develop strategies that yield an advantage over rivals, and develop the data science skills to lead more effectively, allocate resources, and to confront this very challenging environment with confidence.

Jun 14th 2026
4 Weeks
Inferential Statistics (Coursera) Coursera
University of Amsterdam

Inferential Statistics (Coursera)

Inferential statistics are concerned with making inferences based on relations found in the sample, to relations in the population. Inferential statistics help us decide, for example, whether the differences between groups that we see in our data are strong enough to provide support for our hypothesis that group differences exist in general, in the entire population. We will start by considering the basic principles of significance testing: the sampling and test statistic distribution, p-value, significance level, power and type I and type II errors. Then we will consider a large number of statistical tests and techniques that help us make inferences for different types of data and different types of research designs.

Jun 8th 2026
5-12 Weeks
Pattern Discovery in Data Mining (Coursera) Coursera
University of Illinois at Urbana-Champaign

Pattern Discovery in Data Mining (Coursera)

Learn the general concepts of data mining along with basic methodologies and applications. Then dive into one subfield in data mining: pattern discovery. Learn in-depth concepts, methods, and applications of pattern discovery in data mining. We will also introduce methods for data-driven phrase mining and some interesting applications of pattern discovery. This course provides you the opportunity to learn skills and content to practice and engage in scalable pattern discovery methods on massive transactional data, discuss pattern evaluation measures, and study methods for mining diverse kinds of patterns, sequential patterns, and sub-graph patterns.

Jun 8th 2026
4 Weeks
Probabilistic Graphical Models 1: Representation (Coursera) Coursera
Stanford University

Probabilistic Graphical Models 1: Representation (Coursera)

Probabilistic graphical models (PGMs) are a rich framework for encoding probability distributions over complex domains: joint (multivariate) distributions over large numbers of random variables that interact with each other. These representations sit at the intersection of statistics and computer science, relying on concepts from probability theory, graph algorithms, machine learning, and more. They are the basis for the state-of-the-art methods in a wide variety of applications, such as medical diagnosis, image understanding, speech recognition, natural language processing, and many, many more. They are also a foundational tool in formulating many machine learning problems.

Jun 8th 2026
5-12 Weeks
Text Retrieval and Search Engines (Coursera) Coursera
University of Illinois at Urbana-Champaign

Text Retrieval and Search Engines (Coursera)

Recent years have seen a dramatic growth of natural language text data, including web pages, news articles, scientific literature, emails, enterprise documents, and social media such as blog articles, forum posts, product reviews, and tweets. Text data are unique in that they are usually generated directly by humans rather than a computer system or sensors, and are thus especially valuable for discovering knowledge about people’s opinions and preferences, in addition to many other kinds of knowledge that we encode in text.

Jun 8th 2026
5-12 Weeks