Understanding statistics is essential to understand research in the social and behavioral sciences. In this course you will learn the basics of statistics; not just how to calculate them, but also how to evaluate them. This course will also prepare you for the next course in the specialization - the course Inferential Statistics. In the first part of the course we will discuss methods of descriptive statistics. You will learn what cases and variables are and how you can compute measures of central tendency (mean, median and mode) and dispersion (standard deviation and variance). Next, we discuss how to assess relationships between variables, and we introduce the concepts correlation and regression.
Class Deals by MOOC List - Click here and see Coursera's Active Discounts, Deals, and Promo Codes.
The second part of the course is concerned with the basics of probability: calculating probabilities, probability distributions and sampling distributions. You need to know about these things in order to understand how inferential statistics work.
The third part of the course consists of an introduction to methods of inferential statistics - methods that help us decide whether the patterns we see in our data are strong enough to draw conclusions about the underlying population we are interested in. We will discuss confidence intervals and significance tests.
You will not only learn about all these statistical concepts, you will also be trained to calculate and generate these statistics yourself using freely available statistical software.
Course 3 of 5 in the Methods and Statistics in Social Sciences Specialization.
Syllabus
WEEK 1
Before we get started...
In this module we'll consider the basics of statistics. But before we start, we'll give you a broad sense of what the course is about and how it's organized. Are you new to Coursera or still deciding whether this is the course for you? Then make sure to check out the 'Course introduction' and 'What to expect from this course' sections below, so you'll have the essential information you need to decide and to do well in this course! If you have any questions about the course format, deadlines or grading, you'll probably find the answers here. Are you a Coursera veteran and ready to get started? Then you might want to skip ahead to the first course topic: 'Exploring data'. You can always check the general information later. Veterans and newbies alike: Don't forget to introduce yourself in the 'meet and greet' forum!
Exploring Data
In this first module, we’ll introduce the basic concepts of descriptive statistics. We’ll talk about cases and variables, and we’ll explain how you can order them in a so-called data matrix. We’ll discuss various levels of measurement and we’ll show you how you can present your data by means of tables and graphs. We’ll also introduce measures of central tendency (like mode, median and mean) and dispersion (like range, interquartile range, variance and standard deviation). We’ll not only tell you how to interpret them; we’ll also explain how you can compute them. Finally, we’ll tell you more about z-scores. In this module we’ll only discuss situations in which we analyze one single variable. This is what we call univariate analysis. In the next module we will also introduce studies in which more variables are involved.
WEEK 2
Correlation and Regression
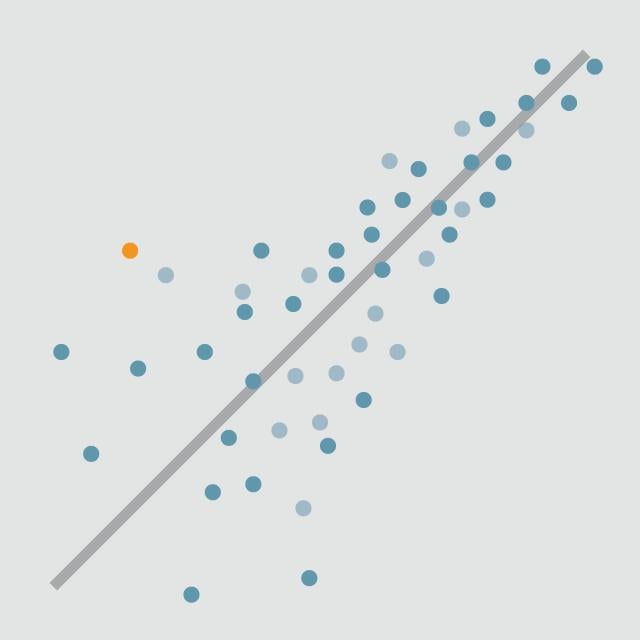
In this second module we’ll look at bivariate analyses: studies with two variables. First we’ll introduce the concept of correlation. We’ll investigate contingency tables (when it comes to categorical variables) and scatterplots (regarding quantitative variables). We’ll also learn how to understand and compute one of the most frequently used measures of correlation: Pearson's r. In the next part of the module we’ll introduce the method of OLS regression analysis. We’ll explain how you (or the computer) can find the regression line and how you can describe this line by means of an equation. We’ll show you that you can assess how well the regression line fits your data by means of the so-called r-squared. We conclude the module with a discussion of why you should always be very careful when interpreting the results of a regression analysis.
WEEK 3
Probability
This module introduces concepts from probability theory and the rules for calculating with probabilities. This is not only useful for answering various kinds of applied statistical questions but also to understand the statistical analyses that will be introduced in subsequent modules. We start by describing randomness, and explain how random events surround us. Next, we provide an intuitive definition of probability through an example and relate this to the concepts of events, sample space and random trials. A graphical tool to understand these concepts is introduced here as well, the tree-diagram.Thereafter a number of concepts from set theory are explained and related to probability calculations. Here the relation is made to tree-diagrams again, as well as contingency tables. We end with a lesson where conditional probabilities, independence and Bayes rule are explained. All in all, this is quite a theoretical module on a topic that is not always easy to grasp. That's why we have included as many intuitive examples as possible.
WEEK 4
Probability Distributions
Probability distributions form the core of many statistical calculations. They are used as mathematical models to represent some random phenomenon and subsequently answer statistical questions about that phenomenon. This module starts by explaining the basic properties of a probability distribution, highlighting how it quantifies a random variable and also pointing out how it differs between discrete and continuous random variables. Subsequently the cumulative probability distribution is introduced and its properties and usage are explained as well. In a next lecture it is shown how a random variable with its associated probability distribution can be characterized by statistics like a mean and variance, just like observational data. The effects of changing random variables by multiplication or addition on these statistics are explained as well.The lecture thereafter introduces the normal distribution, starting by explaining its functional form and some general properties. Next, the basic usage of the normal distribution to calculate probabilities is explained. And in a final lecture the binomial distribution, an important probability distribution for discrete data, is introduced and further explained. By the end of this module you have covered quite some ground and have a solid basis to answer the most frequently encountered statistical questions. Importantly, the fundamental knowledge about probability distributions that is presented here will also provide a solid basis to learn about inferential statistics in the next modules.
WEEK 5
Sampling Distributions
Methods for summarizing sample data are called descriptive statistics. However, in most studies we’re not interested in samples, but in underlying populations. If we employ data obtained from a sample to draw conclusions about a wider population, we are using methods of inferential statistics. It is therefore of essential importance that you know how you should draw samples. In this module we’ll pay attention to good sampling methods as well as some poor practices. To draw conclusions about the population a sample is from, researchers make use of a probability distribution that is very important in the world of statistics: the sampling distribution. We’ll discuss sampling distributions in great detail and compare them to data distributions and population distributions. We’ll look at the sampling distribution of the sample mean and the sampling distribution of the sample proportion.
WEEK 6
Confidence Intervals
We can distinguish two types of statistical inference methods. We can: (1) estimate population parameters; and (2) test hypotheses about these parameters. In this module we’ll talk about the first type of inferential statistics: estimation by means of a confidence interval. A confidence interval is a range of numbers, which, most likely, contains the actual population value. The probability that the interval actually contains the population value is what we call the confidence level. In this module we’ll show you how you can construct confidence intervals for means and proportions and how you should interpret them. We’ll also pay attention to how you can decide how large your sample size should be.
WEEK 7
Significance Tests
In this module we’ll talk about statistical hypotheses. They form the main ingredients of the method of significance testing. An hypothesis is nothing more than an expectation about a population. When we conduct a significance test, we use (just like when we construct a confidence interval) sample data to draw inferences about population parameters. The significance test is, therefore, also a method of inferential statistics. We’ll show that each significance test is based on two hypotheses: the null hypothesis and the alternative hypothesis. When you do a significance test, you assume that the null hypothesis is true unless your data provide strong evidence against it. We’ll show you how you can conduct a significance test about a mean and how you can conduct a test about a proportion. We’ll also demonstrate that significance tests and confidence intervals are closely related. We conclude the module by arguing that you can make right and wrong decisions while doing a test. Wrong decisions are referred to as Type I and Type II errors.
WEEK 8
Exam time!
This is the final module, where you can apply everything you've learned until now in the final exam. Please note that you can only take the final exam once a month, so make sure you are fully prepared to take the test. Please follow the honor code and do not communicate or confer with others while taking this exam. Good luck!