Microsoft Excel - Excel for everyday - Updated 2020 (Skillshare)

Offered by Skillshare,
Microsoft Excel - Excel for everyday - Updated 2020 (Skillshare)

This Microsoft Excel course helps the learners to understand how to work and manage data sets, It focuses on understanding rather memorizing, which leads into great results in a very short time. You will learn many topics: Overview of Excel, Data entry, Creating Charts, Formulas, most common functions like Sum(), Average()…etc. In a very short time, you will be able able to say you really know excel. You will become the Excel master in your organisation or Business.

This course will help the learners to improve their skills and be familiar with Microsoft Excel. Now a days, Microsoft Excel is one of the most important and used program world wide.

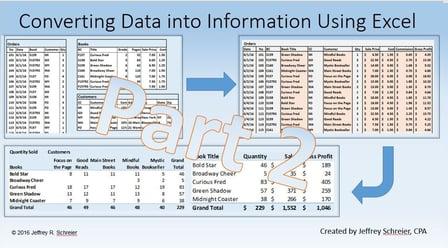
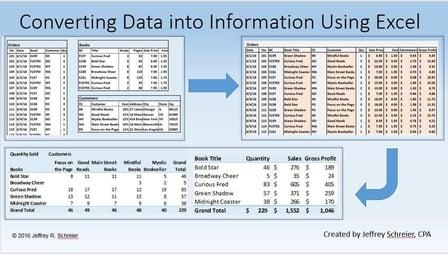
What is this Excel course about?
In this guide to Microsoft Excel course, you'll not only learn all of the principles of Microsoft Excel, but also how to understand and become a star in your field.
This course will cover Beginners, Intermediate and Advanced levels of excle, including:

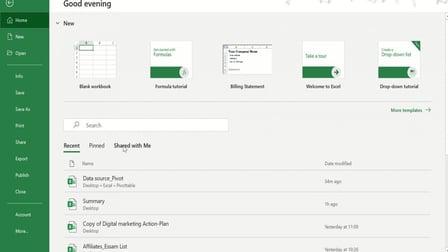
  • Overview of Excel, What is it for and how to use it
  • Entering, editing, formatting data in Excel
  • Formulas and main functions in Excel; Sum, Average, Min, Max...etc.
  • Charts and visualisation

Learn from someone who is currently working in the industry, who knows the most current teaching techniques.
By the end of this course, your confidence as Data analyst using Excel will soar. You'll have a thorough understanding of how to use Excel in a business or personal environment.
Go ahead and click the enroll button, and I'll see you in lesson 1!

Project Description
Share what you have learned in this course.

  • Project #1:

. Open a new workbook, rename the worksheet to be: Cities Population
. On cells A2 - A11, Enter the names of any 10 cities.
. Write the title (Header) of Column A to be: Cities
. On cells B2 - B11, Enter the population of the 10 cities. You can find it on google.
. On cell B12, Find the total population of the 10 cities, use the SUM() function.
. On cell B13, Find the Average population of the 10 cities, use the AVERAGE() function.
. On cell B14, Find the minimum population of the 10 cities, use the MIN() function.
. On cell B15, Find the Maximum population of the 10 cities, use the MAX() function.

  • Share your results in the course, for peer and instructors feedback
Go to Class
MOOC List is learner-supported. When you buy through links on our site, we may earn an affiliate commission.

Related Courses

Analyze Data to Answer Questions (Coursera) Coursera
Google

Analyze Data to Answer Questions (Coursera)

This is the fifth course in the Google Data Analytics Certificate. These courses will equip you with the skills needed to apply to introductory-level data analyst jobs. In this course, you’ll explore the “analyze” phase of the data analysis process. You’ll take what you’ve learned to this point and apply it to your analysis to make sense of the data you’ve collected. You’ll learn how to organize and format your data using spreadsheets and SQL to help you look at and think about your data in different ways. You’ll also find out how to perform complex calculations on your data to complete business objectives.

Jun 2nd 2026
4 Weeks
Share Data Through the Art of Visualization (Coursera) Coursera
Google

Share Data Through the Art of Visualization (Coursera)

This is the sixth course in the Google Data Analytics Certificate. These courses will equip you with the skills needed to apply to introductory-level data analyst jobs. You’ll learn how to visualize and present your data findings as you complete the data analysis process. This course will show you how data visualizations, such as visual dashboards, can help bring your data to life. You’ll also explore Tableau, a data visualization platform that will help you create effective visualizations for your presentations.

Jun 2nd 2026
4 Weeks
Visual Thinking: Drawing Data to Communicate Ideas (Skillshare) Skillshare
Skillshare

Visual Thinking: Drawing Data to Communicate Ideas (Skillshare)

Dive into functional drawing! Join information designer and artist Catherine Madden for a 60-minute class demystifying how drawing can help you communicate ideas clearer, faster, and stronger. As she draws everyday data into friendly stories and charts, you'll learn how a few simple moves can help you organize your ideas, extend your brainstorming, and communicate complex concepts simply (and effectively) to audiences of every size.

Self Paced
Self-Paced
Converting Data into Information Using Excel (Skillshare) Skillshare
Skillshare

Converting Data into Information Using Excel (Skillshare)

Welcome to my course "Converting Data into Information Using Excel" This course is designed to help you grow beyond using basic Excel spreadsheet creation and formatting skills, and show you how to use Excel to add value in ways you were not previously exposed to. I specifically cover proper database creation, the vlookup formula, pivot table reporting, filtering and several text formulas including the "If" formula.

Self Paced
Self-Paced
Power Pivot Introduction - A Beginners Guide to Power Pivot (Skillshare) Skillshare
Skillshare

Power Pivot Introduction - A Beginners Guide to Power Pivot (Skillshare)

This class is a beginners guide to Power Pivot. If you are new to Power Pivot, maybe you've never heard of it, well this class was made for you. The class starts with learning what Power Pivot is and what its advantages are. Then we take you through the whole lifecycle from importing data into the model, preparing it, writing powerful DAX calculations and finally creating PivotTables and Slicers to analyse the data.

Self Paced
Self-Paced
Power BI Desktop Introduction - A Complete Beginners Guide (Skillshare) Skillshare
Skillshare

Power BI Desktop Introduction - A Complete Beginners Guide (Skillshare)

This class is an introduction to Power BI Desktop. This class is a complete beginners guide to the software. It starts by explaining what Power BI Desktop is and why you would use it. We then show how to install the software and the different options available. We then create a Power BI report following the entire process. We get the data from different external sources, clean and shape the data, model it and then create DAX formulas and visualizations.

Self Paced
Self-Paced
Process Mining: Data science in Action (Coursera) Coursera
Eindhoven University of Technology

Process Mining: Data science in Action (Coursera)

Process mining is the missing link between model-based process analysis and data-oriented analysis techniques. Through concrete data sets and easy to use software the course provides data science knowledge that can be applied directly to analyze and improve processes in a variety of domains. Data science is the profession of the future, because organizations that are unable to use (big) data in a smart way will not survive. It is not sufficient to focus on data storage and data analysis. The data scientist also needs to relate data to process analysis.

Jun 1st 2026
5-12 Weeks
Reproducible Research (Coursera) Coursera
Johns Hopkins University

Reproducible Research (Coursera)

This course focuses on the concepts and tools behind reporting modern data analyses in a reproducible manner. Reproducible research is the idea that data analyses, and more generally, scientific claims, are published with their data and software code so that others may verify the findings and build upon them. The need for reproducibility is increasing dramatically as data analyses become more complex, involving larger datasets and more sophisticated computations.

Jun 1st 2026
4 Weeks
Excel: Make Your Budget Sheet (Skillshare) Skillshare
Skillshare

Excel: Make Your Budget Sheet (Skillshare)

Welcome to this class, where I will show you how to manage your incomes and expenses (especially when you are not from accounts background) in a very simple and effective manner. You earn money and spends it on different channels but it is much important to know how much you are earning, how much you are spending and how much you have saved.

Self Paced
Self-Paced
Master Data Analysis with Python - Intro to Pandas (Skillshare) Skillshare
Skillshare

Master Data Analysis with Python - Intro to Pandas (Skillshare)

Master Data Analysis with Python - Intro to Pandas targets those who want to completely master doing data analysis with pandas. This course provides an introduction to the components of the two primary pandas objects, the DataFrame and Series, and how to select subsets of data from them. This course is taught by expert instructor Ted Petrou, author of the highly-rated book Pandas Cookbook.

Self Paced
Self-Paced
Data Visualization (Coursera) Coursera
Ball State University

Data Visualization (Coursera)

In the era of big data, acquiring the ability to analyze and visually represent “Big Data” in a compelling manner is crucial. Therefore, it is essential for data scientists to develop the skills in producing and critically interpreting digital maps, charts, and graphs. Data visualization is an increasingly important topic in our globalized and digital society. It involves graphically representing data or information, enabling decision-makers across various industries to comprehend complex concepts and processes that may otherwise be challenging to grasp.

Jun 2nd 2026
5-12 Weeks