EdX

Introducción a Power BI para los negocios (edX)

Introducción a Power BI para los negocios (edX)

Te presentamos los componentes de Power BI, te mostramos la herramienta gratuita Power BI Desktop y te enseñamos a usarla para cargar y tratar datos de diversas fuentes, relacionar los datos importados e incorporar medidas para extraer la información importante y manejar las visualizaciones gráficas más habituales y utilizar los filtros para presentarla de la mejor manera posible.

Class Deals by MOOC List - Click here and see EdX's Active Discounts, Deals, and Promo Codes.

¿Necesitas incorporar la inteligencia de negocio a tu empresa de forma que te permita analizar cantidades ingentes de datos para tomar las mejores decisiones? Power BI Desktop, la herramienta gratuita de análisis de datos de Microsoft te ayudará a conseguirlo con el menor esfuerzo posible.
Power BI Desktop te ofrece Power Query, una herramienta para importar, limpiar y acondicionar los datos a través de procesos automatizados, el modelo de datos, que te permitirá establecer relaciones entre los datos importados y añadir medidas complejas que sinteticen las conclusiones más importantes y una gran cantidad de visualizaciones que te permitirán presentar estos datos de forma interactiva y conectada y, no solo esto, si necesitas trabajar en equipo te ofrece una potente herramienta colaborativa en la nube (de pago) que, además, se integra con las herramientas de Microsoft Office y Teams.
En este primer curso de Power BI te presentamos los componentes de Power BI, te mostramos la herramienta gratuita Power BI Desktop y te enseñamos a usarla para cargar y tratar datos de diversas fuentes, relacionar los datos importados e incorporar medidas para extraer la información importante y manejar las visualizaciones gráficas más habituales y utilizar los filtros para presentarla de la mejor manera posible.
This course is part of the Power Bi para los negocios Professional Certificate.
What you'll learn
En este curso aprenderás

  • Qué es Power BI y cuáles son sus componentes
  • Cómo cargar datos de distintas fuentes en Power BI Desktop usando Power Query
  • Cómo establecer relaciones entre los datos cargados y cómo añadir campos y medidas para extraer la información que te interesa
  • Cómo crear paneles de datos que comuniquen la información de forma efectiva
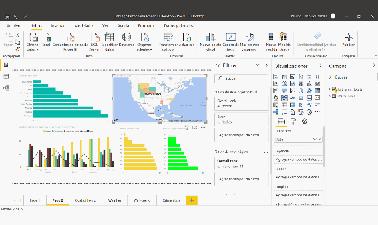
  • Cuáles son las principales visualizaciones dispobles en Power BI, como organizarlas en el canvas y cómo filtrar la información

Syllabus

Módulo 1: ¿Qué es Power BI?
Módulo 2: Carga de datos con Power Query
Módulo 3: El Modelo de datos y las medidas
Módulo 4: Visualización de datos
Examen final

Go to Class
MOOC List is learner-supported. When you buy through links on our site, we may earn an affiliate commission.

Related Courses

Database Design and Operational Business Intelligence (Coursera) Coursera
Edureka

Database Design and Operational Business Intelligence (Coursera)

Welcome to the course on Database Design and Operational Business Intelligence. This course is strategically crafted to empower you with the skills needed to design a robust database and efficiently manage intricate datasets. Throughout this course, you will acquire the expertise to develop well-formatted databases that are seamlessly designed to integrate with Power BI.

Jun 22nd 2026
4 Weeks
Computing for Data Analysis (edX) EdX
Georgia Institute of Technology,GTx

Computing for Data Analysis (edX)

A hands-on introduction to basic programming principles and practice relevant to modern data analysis, data mining, and machine learning. The modern data analysis pipeline involves collection, preprocessing, storage, analysis, and interactive visualization of data. In the course, you’ll see how computing and mathematics come together.

Aug 19th 2024
13-24 Weeks
Derivatives Markets: Advanced Modeling and Strategies (edX) EdX
MIT,MITx

Derivatives Markets: Advanced Modeling and Strategies (edX)

Financial derivatives are ubiquitous in global capital markets. Students will obtain a sophisticated understanding of valuation methods; tools for quantifying, hedging, and speculating on risk; and a basic familiarity with major markets and instruments. Financial derivatives are ubiquitous in global capital markets, and those products and the institutions around them continue to evolve at a rapid pace.

Sep 18th 2024
5-12 Weeks
Power BI Desktop Introduction - A Complete Beginners Guide (Skillshare) Skillshare
Skillshare

Power BI Desktop Introduction - A Complete Beginners Guide (Skillshare)

This class is an introduction to Power BI Desktop. This class is a complete beginners guide to the software. It starts by explaining what Power BI Desktop is and why you would use it. We then show how to install the software and the different options available. We then create a Power BI report following the entire process. We get the data from different external sources, clean and shape the data, model it and then create DAX formulas and visualizations.

Self Paced
Self-Paced
Business Analyst (Dataquest) Dataquest
Dataquest

Business Analyst (Dataquest)

Gain the skills you need to start a career as a Business Analyst. In this path, you will learn practical SQL, Excel, and Power BI skills. By the end, you will be able to analyze data, communicate insights, and make data-driven decisions.

Self Paced
Self-Paced
Comprendre l'esport (FUN) FUN
Université de Caen

Comprendre l'esport (FUN)

L’esport correspond à la pratique compétitive d’un jeu vidéo. Cette pratique interroge et soulève de nombreuses questions : est-ce possible de la qualifier de sport ? Comment protéger les joueuses et joueurs ? Comment reconnaître leurs compétences et les développer ? L’esport est-il un levier d’inclusion ou d’exclusion ? Le modèle économique de l’esport est-il durable ? Quel est son ancrage territorial ou son lien avec les collectivités ? Et enfin, question renforcée par la crise sanitaire de 2020, l’esport va-t-il renouveler notre rapport à la pratique sportive ou à la consommation de spectacle sportif ?

Mar 29th 2021
5-12 Weeks
Data Storytelling with Power BI (Coursera) Coursera
Edureka

Data Storytelling with Power BI (Coursera)

Welcome to the Data Storytelling with Power BI course, where you'll embark on a journey to acquire practical expertise in data transformation and visualization. Leverage the potential of Power BI to craft narratives through structured data, leading to the discovery of more profound insights. Throughout this course, you'll explore the industry-specific applications of Power BI and delve into its various features and functionalities.

Jun 22nd 2026
5-12 Weeks
Creative Designing in Power BI (Coursera) Coursera
Microsoft

Creative Designing in Power BI (Coursera)

This course forms part of the Microsoft Power BI Analyst Professional Certificate. This Professional Certificate consists of a series of courses that offers a good starting point for a career in data analysis using Microsoft Power BI. In this course, you will learn how to creatively design dashboards, reports and charts that are easier for the audience to use.

Jun 15th 2026
4 Weeks