EdX

Data Visualization and Storytelling (edX)

Data Visualization and Storytelling (edX)

Learn the skills of digital storytelling necessary to tell compelling stories with data through visualization tools. In this course, you will learn the skills necessary to tell compelling stories with data through visualization tools. You will gain a superpower allowing you to influence others through the craft of storytelling with data.

Class Deals by MOOC List - Click here and see EdX's Active Discounts, Deals, and Promo Codes.

Raw data alone struggles to provide insights to an audience. To spotlight the objective of your data, you need to present it in a story-driven format to engage the audience. By combining no-code data visualization tools with storytelling best practices, you will learn how to convert data into an effective communication tool. Gaining the skill of digital storytelling will enable you to persuade people by uniting a data driven idea with a human emotion. After all, stories can be the most powerful skill within an effective communicators’ toolbox.
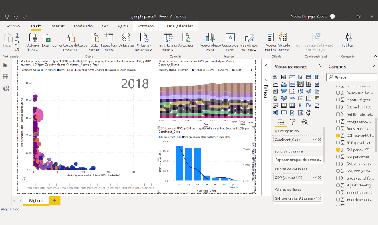
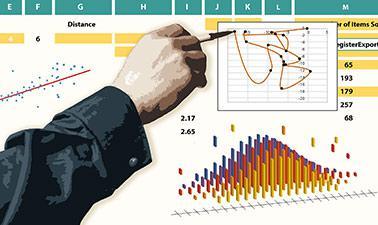
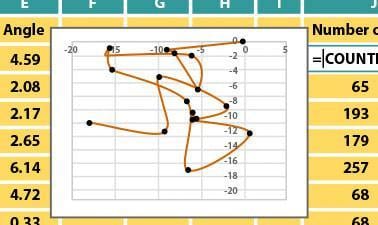
This hands-on course will be helpful for anyone who works with data, big or small. You will learn how to communicate your data with others in a clear, concise and compelling manner. You will complete the course with a portfolio of data visualization projects, analog and digital, that demonstrate the application of data storytelling. Learn how to pair visual representations like charts, diagrams, infographics and dashboards with storytelling techniques to strengthen delivery and provide honest interpretations of the data.
This course summary represents an initiative aimed at engaging learners early in the course development process to submit course design feedback. By enrolling in the free audit version of this course, you are “voting” for us to build the course since the curriculum does not yet exist. After signing up, you will have the opportunity to provide qualitative feedback which will be used to determine aspects of the potential course design process. We will only email you to let you know whether we are building the course, and you are welcome to unenroll at any time.
If there is enough interest from learners in this course, early enrollment will provide you with free access to supplemental course content and an opportunity to influence the direction of the course build via your feedback. If there is not enough interest in this course, it may not be built. By including learners in this process, we hope to provide access to a larger and more diverse group of learners.

What you'll learn

  • The keys to being successful in data storyteller- including understanding the context, choosing an effective visual, eliminating clutter, focusing attention and telling a compelling story to your audience
  • Ability to cultivate a captivating story with data using visualizations
  • How to feature the right data in the right visual format
  • How to provide critical insights to back up your claims
Go to Class
MOOC List is learner-supported. When you buy through links on our site, we may earn an affiliate commission.

Related Courses

Excel for Everyone: Core Foundations (edX) EdX
The University of British Columbia,UBCx

Excel for Everyone: Core Foundations (edX)

Learn Excel fundamentals including data wrangling, spreadsheet management, and basic data analysis. This introductory Excel course will equip you with a strong foundational knowledge of Excel to organize, analyze and work with data. You will develop essential Excel skills, such as simple data wrangling and managing spreadsheets, along with a foundational understanding of business data analysis.

Self Paced
Self-Paced
RShiny for Everyone (edX) EdX
Davidson College,DavidsonX

RShiny for Everyone (edX)

Use R’s Shiny package to create data-driven, interactive web applications. In this course, you will use R Shiny to create an interactive web application that highlights the biodiversity of America’s National Parks. Your application will feature an interactive map, biodiversity calculator, trail journal and species images. Using R Shiny, you will expand your data analysis and visualization skills while developing your workflow through web application deployment.

Self Paced
Self-Paced
Visualizing Data with R (edX) EdX
IBM

Visualizing Data with R (edX)

Learn about the ggplot2 data visualization package for R, creating map plots with geolocation data using Leaflet, and interactive dashboards to display your work on the web using the R Shiny package! In this course, you will learn about the Grammar of Graphics, a system for describing and building graphs, and how the ggplot2 data visualization package for R applies this concept to basic bar charts, histograms, pie charts, scatter plots, line plots, and box plots.

Self Paced
Self-Paced
Platform-Based Analytics (edX) EdX
Indiana University,IUx

Platform-Based Analytics (edX)

Gain hands-on experience extracting, preparing, exploring, and analyzing data statistically and visually using features and tools native to Microsoft Excel. In an ever-growing digital world, the need for strong data analysis skills is at the forefront of every business function, along with the ability to accurately describe and interpret analytical findings.

Nov 7th 2023
5-12 Weeks
Worldbuilding for Video Games (edX) EdX
The University of British Columbia,UBCx

Worldbuilding for Video Games (edX)

Learn the fundamentals of building video game worlds, from a writer’s perspective. A game’s setting is second in importance only to the game’s player character - and some say it’s more important. Game designers must create a compelling new world that players will want to explore and inhabit for many, many hours.

Self Paced
Self-Paced
Data Analysis: Building Your Own Business Dashboard (edX) EdX
Delft University of Technology,DelftX

Data Analysis: Building Your Own Business Dashboard (edX)

Dive in headfirst and carry out an independent data analysis. Build and design your own dashboard based on raw data to better inform business decisions. Are you ready to leave the sandbox and go for the real deal? Have you followed EX101x Data Analysis: Take It to the MAX() and EX102x Data Analysis: Visualization and Dashboard Design and are ready to carry out more robust data analysis?

No sessions available
5-12 Weeks
Análisis de datos: Llévalo al MAX() (edX) EdX
Delft University of Technology,DelftX

Análisis de datos: Llévalo al MAX() (edX)

Incrementa tus habilidades de análisis de datos utilizando hojas de cálculo y visualización de datos en Excel. Aumenta tu productividad y produce mejores decisiones de negocio. Este curso de análisis de datos (business intelligence: BI) y estadísticas es para todos aquellos que quieren mejorar sus habilidades en el análisis de datos. ¿Buscas una forma inteligente de visualizar los datos para que tengan sentido? ¿Quieres entender esa colección de datos loca que te dio tu jefe? ¿Tienes Megabytes de sensores de datos para analizar? ¡No te preocupes, lo tenemos cubierto!

Self Paced
Self-Paced
Statistical Thinking for Data Science and Analytics (edX) EdX
Columbia University,ColumbiaX

Statistical Thinking for Data Science and Analytics (edX)

Learn how statistics plays a central role in the data science approach. This statistics and data analysis course will pave the statistical foundation for our discussion on data science. You will learn how data scientists exercise statistical thinking in designing data collection, derive insights from visualizing data, obtain supporting evidence for data-based decisions and construct models for predicting future trends from data.

Self Paced
Self-Paced
Storytelling for Social Change (edX) EdX
University of Michigan,MichiganX

Storytelling for Social Change (edX)

Use stories to deliver messages that affect people. Learn how to craft a story that develops empathy and delivers impact. How can storytelling promote social change? This course develops skills for using stories to deliver messages that affect audiences and shape attitudes for social change. Learn how building empathy and developing characters can offer multiple perspectives on complex problems.

Self Paced
Self-Paced
Visualizing Data with Python (edX) EdX
IBM

Visualizing Data with Python (edX)

Data visualization is the graphical representation of data in order to interactively and efficiently convey insights to clients, customers, and stakeholders in general. "A picture is worth a thousand words." We are all familiar with this expression. It especially applies when trying to explain the insights obtained from the analysis of increasingly large datasets. Data visualization plays an essential role in the representation of both small and large-scale data. One of the key skills of a data scientist is the ability to tell a compelling story, visualizing data and findings in an approachable and stimulating way.

Self Paced
Self-Paced