EdX

The Analytics Edge (edX)

Offered by MIT, MITx,
The Analytics Edge (edX)

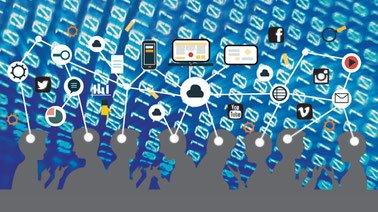
Through inspiring examples and stories, discover the power of data and use analytics to provide an edge to your career and your life. In the last decade, the amount of data available to organizations has reached unprecedented levels. Data is transforming business, social interactions, and the future of our society. In this course, you will learn how to use data and analytics to give an edge to your career and your life.

Class Deals by MOOC List - Click here and see EdX's Active Discounts, Deals, and Promo Codes.

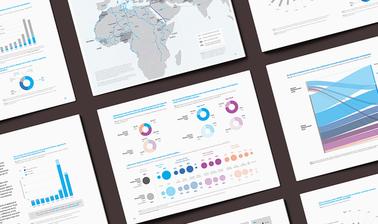
We will examine real world examples of how analytics have been used to significantly improve a business or industry. These examples include Moneyball, eHarmony, the Framingham Heart Study, Twitter, IBM Watson, and Netflix. Through these examples and many more, we will teach you the following analytics methods: linear regression, logistic regression, trees, text analytics, clustering, visualization, and optimization. We will be using the statistical software R to build models and work with data. The contents of this course are essentially the same as those of the corresponding MIT class (The Analytics Edge). It is a challenging class, but it will enable you to apply analytics to real-world applications.

The class will consist of lecture videos, which are broken into small pieces, usually between 4 and 8 minutes each. After each lecture piece, we will ask you a “quick question” to assess your understanding of the material. There will also be a recitation, in which one of the teaching assistants will go over the methods introduced with a new example and data set. Each week will have a homework assignment that involves working in R or LibreOffice with various data sets. (R is a free statistical and computing software environment we’ll use in the course. See the Software FAQ below for more info). At the end of the class there will be a final exam, which will be similar to the homework assignments.

What you'll learn

  • An applied understanding of many different analytics methods, including linear regression, logistic regression, CART, clustering, and data visualization
  • How to implement all of these methods in R
  • An applied understanding of mathematical optimization and how to solve optimization models in spreadsheet software
Go to Class
MOOC List is learner-supported. When you buy through links on our site, we may earn an affiliate commission.

Related Courses

Analyzing and Visualizing Data with Power BI (edX) EdX
Davidson College,DavidsonX

Analyzing and Visualizing Data with Power BI (edX)

Step up your analytics game and learn one of the most in-demand job skills in the United States. Power BI is a robust business analytics and visualization tool from Microsoft that helps data professionals bring their data to life and tell more meaningful stores. This four-week course is a beginner's guide to working with data in Power BI and is perfect for professionals. You'll become confident in working with data, creating data visualizations, and preparing reports and dashboards.

Self Paced
Self-Paced
Knowledge Management and Big Data in Business (edX) EdX
The Hong Kong Polytechnic University,HKPolyUx

Knowledge Management and Big Data in Business (edX)

Learn why and how knowledge management and Big Data are vital to the new business era. The business landscape is changing so rapidly that traditional management, business and computing courses do not meet the needs for the next generation of workers in the business world. Most traditional methods are of a repetitive, rule-based nature and will be gradually replaced by Artificial Intelligence.

Self Paced
Self-Paced
Data Analysis: Statistical Modeling and Computation in Applications (edX) EdX
MIT,MITx

Data Analysis: Statistical Modeling and Computation in Applications (edX)

A hands-on introduction to the interplay between statistics and computation for the analysis of real data. -- Part of the MITx MicroMasters program in Statistics and Data Science. Data science requires multi-disciplinary skills ranging from mathematics, statistics, machine learning, problem solving to programming, visualization, and communication skills. In this course, learners will combine these foundational and practical skills with domain knowledge to ask and answer questions using real data.

May 13th 2024
13-24 Weeks
Foundations of Data Analysis - Part 1: Statistics Using R (edX) EdX
University of Texas at Austin,UTAustinX

Foundations of Data Analysis - Part 1: Statistics Using R (edX)

This is a hands on course with a data lab to teach fundamental statistical topics such as descriptive statistics, inferential testing, and modeling. In this first part of a two part course, we’ll walk through the basics of statistical thinking – starting with an interesting question. Then, we’ll learn the correct statistical tool to help answer our question of interest – using R and hands-on Labs.

No sessions available
5-12 Weeks
Enabling Technologies for Data Science and Analytics: The Internet of Things (edX) EdX
Columbia University,ColumbiaX

Enabling Technologies for Data Science and Analytics: The Internet of Things (edX)

Discover the relationship between Big Data and the Internet of Things (IoT). The Internet of Things is rapidly growing. It is predicted that more than 25 billion devices will be connected by 2020. In this data science course, you will learn about the major components of the Internet of Things and how data is acquired from sensors. You will also examine ways of analyzing event data, sentiment analysis, facial recognition software and how data generated from devices can be used to make decisions.

Self Paced
Self-Paced
Case Studies in Functional Genomics (edX) EdX
HarvardX,Harvard University

Case Studies in Functional Genomics (edX)

Perform RNA-Seq, ChIP-Seq, and DNA methylation data analyses, using open source software, including R and Bioconductor. We will explain how to perform the standard processing and normalization steps, starting with raw data, to get to the point where one can investigate relevant biological questions.

Self Paced
Self-Paced
Datos para la efectividad de las políticas públicas (edX) EdX
Inter-American Development Bank - IDB,IDBx

Datos para la efectividad de las políticas públicas (edX)

Este curso te ayudará a tomar el control de los datos y familiarizarte con las herramientas para utilizarlos en la planificación, gestión y evaluación de políticas publicas. En esta era de la información, los datos están disponibles en todos lados y crecen a una tasa exponencial. ¿Cómo podemos darles sentido a todos los datos y aprovecharlos en el momento de tomar decisiones?, ¿cómo los utilizamos para que nos ayuden a guiar la gestión y planificación de nuestras políticas? Tanto si eres ciudadano como planificador de políticas, deberías poder responder a estas preguntas.

Self Paced
Self-Paced
Big Data and Education (edX) EdX
University of Pennsylvania,PennX

Big Data and Education (edX)

Learn the methods and strategies for using large-scale educational data to improve education and make discoveries about learning. Online and software-based learning tools have been used increasingly in education. This movement has resulted in an explosion of data, which can now be used to improve educational effectiveness and support basic research on learning.

Self Paced
Self-Paced
Behavioural Economics in Action (edX) EdX
University of Toronto,University of TorontoX

Behavioural Economics in Action (edX)

Learn to use principles and methods of behavioural economics to change behaviours, improve welfare and make better products and policy. How can we get people to save more money, eat healthy foods, engage in healthy behaviors, and make better choices in general? There has been a lot written about the fact that human beings do not process information and make decisions in an optimal fashion.

Self Paced
Self-Paced
Data Analysis: Building Your Own Business Dashboard (edX) EdX
Delft University of Technology,DelftX

Data Analysis: Building Your Own Business Dashboard (edX)

Dive in headfirst and carry out an independent data analysis. Build and design your own dashboard based on raw data to better inform business decisions. Are you ready to leave the sandbox and go for the real deal? Have you followed EX101x Data Analysis: Take It to the MAX() and EX102x Data Analysis: Visualization and Dashboard Design and are ready to carry out more robust data analysis?

No sessions available
5-12 Weeks