Time Series Forecasting (Udacity)

Offered by Udacity,
Time Series Forecasting (Udacity)

Use models to forecast the future. The Time Series Forecasting course provides students with the foundational knowledge to build and apply time series forecasting models in a variety of business contexts. In this course, you’ll learn how to use advanced forecasting models to predict the future. You'll learn this through improving your fluency in Alteryx, a data analytics tool that enables you prepare, blend, and analyze data quickly.

Class Deals by MOOC List - Click here and see Udacity's Active Discounts, Deals, and Promo Codes.

You will learn:

  • The key components of time series data and forecasting models
  • How to use ETS (Error, Trend, Seasonality) models to make forecasts
  • How to use ARIMA (Autoregressive, Integrated, Moving Average) models to make forecasts

Throughout this course you’ll also learn the techniques to apply your knowledge in a data analytics program called Alteryx.
Predictive analytics has proved to be a powerful tool to help businesses analyze data and predict future outcomes and trends. Making forecasts using advanced analytics is crucial in today’s data-driven economy.
This course is ideal for anyone who is interested in pursuing a career in business analysis, but lacks programming experience.
This course is part of the Business Analyst Nanodegree Program.

What You Will Learn

Lesson 1
Time Series Fundamentals

  • Learn what attributes make data a time series.
  • Get introduced to a variety of simple forecasting methods.
  • Learn about seasonality, trends, and cyclical patterns.

Lesson 2
ETS Models

  • Learn how to build and use ETS models.
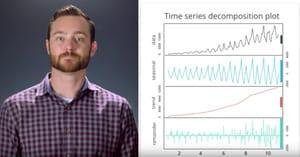
  • Use decomposition plots to visualize time series data.
  • Get practice building an ETS model in Alteryx.

Lesson 3
ARIMA Models

  • Learn how to build and use ARIMA models.
  • Learn the techniques used in seasonal and non-seasonal ARIMAs.
  • Get practice building an ARIMA model in Alteryx.

Lesson 4
Analyzing and Visualizing Results

  • Learn how to interpret time series model results.
  • Learn how to use holdout samples to compare forecasting models.
  • Visualize your forecasts through various plots.

Prerequisites and Requirements

  • No programming experience required.
  • Interested in using data to make better business decisions.
  • Alteryx license (provided to Nanodegree students at no cost, compatible with Windows only)
Go to Class
MOOC List is learner-supported. When you buy through links on our site, we may earn an affiliate commission.

Related Courses

Introduction to Predictive Modeling (Coursera) Coursera
University of Minnesota

Introduction to Predictive Modeling (Coursera)

Welcome to Introduction to Predictive Modeling, the first course in the University of Minnesota’s Analytics for Decision Making specialization. This course will introduce to you the concepts, processes, and applications of predictive modeling, with a focus on linear regression and time series forecasting models and their practical use in Microsoft Excel.

Jun 22nd 2026
4 Weeks
Beyond the Financials: Insights, Analysis and Valuations (Coursera) Coursera
University of Illinois at Urbana-Champaign

Beyond the Financials: Insights, Analysis and Valuations (Coursera)

The objective of this course is to provide you with the knowledge and skills necessary to analyze, interpret, understand and use financial information to make informed decisions. We will discuss financial reporting from a user’s perspective, use a variety of tools to break apart financial reports into meaningful units for analysis, forecast financial statements, and value a firm. This course is intended to give you exposure to the issues facing users of financial statements. You will better understand your role in the financial reporting process if you know how the financial statements will ultimately be used.

Jun 8th 2026
5-12 Weeks
Foundations of strategic business analytics (Coursera) Coursera
ESSEC Business School

Foundations of strategic business analytics (Coursera)

Who is this course for? This course is designed for students, business analysts, and data scientists who want to apply statistical knowledge and techniques to business contexts. For example, it may be suited to experienced statisticians, analysts, engineers who want to move more into a business role. You will find this course exciting and rewarding if you already have a background in statistics, can use R or another programming language and are familiar with databases and data analysis techniques such as regression, classification, and clustering.

Jun 22nd 2026
4 Weeks
Applying Data Analytics in Finance (Coursera) Coursera
University of Illinois at Urbana-Champaign

Applying Data Analytics in Finance (Coursera)

This course introduces an overview of financial analytics. You will learn why, when, and how to apply financial analytics in real-world situations. You will explore techniques to analyze time series data and how to evaluate the risk-reward trade off expounded in modern portfolio theory. While most of the focus will be on the prices, returns, and risk of corporate stocks, the analytical techniques can be leverages in other domains. Finally, a short introduction to algorithmic trading concludes the course.

Jun 28th 2026
4 Weeks
Excel Time Series Models for Business Forecasting (Coursera) Coursera
Macquarie University

Excel Time Series Models for Business Forecasting (Coursera)

This course explores different time series business forecasting methods. The course covers a variety of business forecasting methods for different types of components present in time series data — level, trending, and seasonal. We will learn about the theoretical methods and apply these methods to business data using Microsoft Excel.

Jun 15th 2026
5-12 Weeks
Statistical Analysis Fundamentals using Excel (Coursera) Coursera
IBM

Statistical Analysis Fundamentals using Excel (Coursera)

This course is aimed at familiarizing Data and Business professionals with the basic concepts of statistical analysis and methods used for data-driven decision-making. After completing this course, you will be able to apply descriptive and inferential analysis methods, use data visualization methods to communicate data, apply concepts of probability in real-life scenarios, and apply regression techniques to predict trends.

Jun 22nd 2026
5-12 Weeks
Time, Change, and Decisions for Marketing (Coursera) Coursera
University of Colorado Boulder

Time, Change, and Decisions for Marketing (Coursera)

"Time, Change, and Decisions for Marketing" shows how advanced analytics can be used to adapt and optimize marketing strategies in response to evolving market conditions. Unique to this course is the integration of advanced analytics into strategic marketing decision-making, equipping learners with the skills and knowledge to lead data-driven marketing initiatives and coordinate strategies across teams for maximum business impact.

Jun 22nd 2026
3 Weeks
Fundamentals of Finance (Coursera) Coursera
University of California, Irvine

Fundamentals of Finance (Coursera)

Welcome to Fundamentals of Finance. This 4 module course will help you understand and affect the performance of your unit or organization’s profitability. By the end of this course, you will be able to implement finance and accounting concepts to drive your organization's growth, analyze financial statements and understand the factors in productivity and profitability, and create forecasting and budgeting. You will also have the ability to evaluate and manage cash flow, implement strategies around financing, and use of ratios in running a business.

Jun 15th 2026
4 Weeks