Six Sigma Advanced Define and Measure Phases (Coursera)

Six Sigma Advanced Define and Measure Phases (Coursera)

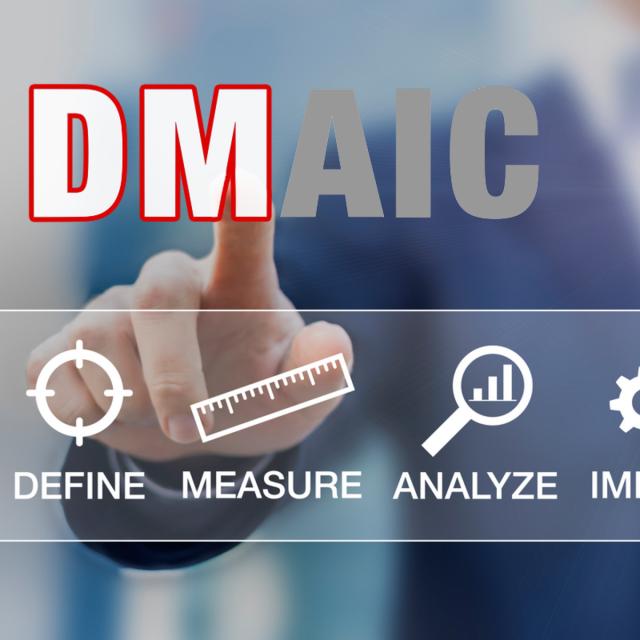
This course is for you if you are looking to dive deeper into Six Sigma or strengthen and expand your knowledge of the basic components of green belt level of Six Sigma and Lean. Six Sigma skills are widely sought by employers both nationally and internationally. These skills have been proven to help improve business processes and performance. This course will take you deeper into the principles and tools associated with the "Design" and "Measure" phases of the DMAIC structure of Six Sigma.

Class Deals by MOOC List - Click here and see Coursera's Active Discounts, Deals, and Promo Codes.

It is highly recommended that you complete the "Yellow Belt Specialization" and the course "Six Sigma and the Organization (Advanced)" before beginning this course.
In this course, your instructors will introduce you to, and have you apply, some of the tools and metrics that are critical components of Six Sigma. This course will provide you with the advanced knowledge of team dynamics and performance, process analysis, probability, statistics, statistical distributions, collecting and summarizing data, measurement systems analysis, process and performance capability, and exploratory data analysis associated with Six Sigma and Lean.
Every module will include readings, videos, and quizzes to help make sure you understand the material and concepts that are studied.
Course 2 of 4 in the Six Sigma Green Belt Specialization

Syllabus

WEEK 1
Yellow Belt Refresher - Team Basics
This module is a Yellow Belt Refresher Area, since some learners may have entered this course without having taken the previous yellow belt material. This refresher area does not serve as a "replacement" for taking the yellow belt specialization. It is only a "patch" for those who already have some knowledge of six sigma, but find the yellow belt specialization to be too introductory for their current situation. If you find yourself struggling with the green belt material in this course, it is highly recommended that you travel through the yellow belt specialization before attempting the green belt content. In this module you will learn about team development, different types of teams, tools for decision making, and tools for communication.

WEEK 2
Process Analysis and Documentation
In this module you will learn the application of process maps and flow charts swim lane. You will also about the application of: written procedures and works instructions, CEDAC, the Pareto diagram, and the relationship matrix.

WEEK 3
Probability and Statistics - pt1
In this module, you will learn how mutually-exclusive events and independent events relate to probability. You will also learn how to solve basic probability problems, including those that require the addition, multiplicative, and conditional rules of probability.

WEEK 4
Probability and Statistics - pt2
In this module, you will learn how to solve probability problems related to combinations and permutations. You will also learn about central limit theorem and how to apply it to the concept of confidence intervals. This module also touches on descriptive and inferential statistics.

WEEK 5
Statistical Distribution
In this module, you will learn about the basic characteristics of probability distributions. You will also learn about binomial, normal, Poisson, t-, chi-square, and F-distributions.

WEEK 6
Collecting and summarising data & measuring system analysis
In this module, you will learn the different types and sources of data. You will also learn: how to classify groups of data for descriptive statistics analysis, different ways to graphically display data, how to express the importance of measurement systems analysis, and the difference between precision and accuracy. This module also begins with a Yellow Belt Refresher Area, since some learners may have entered this course without having taken the previous yellow belt material. This refresher area does not serve as a "replacement" for taking the yellow belt material. It is only a "patch" for those who already have some knowledge of six sigma, but find the yellow belt specialization to be too introductory for their current situation. If you find yourself struggling with the green belt material in this course, it is highly recommended that you travel through the yellow belt specialization before attempting the green belt content.

WEEK 7
Process and performance capability & exploratory data analysis
In this module, you will learn how to use statistical tools and analyze data, including skills like: how to distinguish between natural process limits and specification limits, how to calculate the value of Cp and Ck, how to deal with process capability studies. This module also addresses multi-vari studies, the the correlation coefficient, and linear regression.


Go to Class
MOOC List is learner-supported. When you buy through links on our site, we may earn an affiliate commission.

Related Courses

Visualization for Data Journalism (Coursera) Coursera
University of Illinois at Urbana-Champaign

Visualization for Data Journalism (Coursera)

While telling stories with data has been part of the news practice since its earliest days, it is in the midst of a renaissance. Graphics desks which used to be deemed as “the art department,” a subfield outside the work of newsrooms, are becoming a core part of newsrooms’ operation. Those people (they often have various titles: data journalists, news artists, graphic reporters, developers, etc.) who design news graphics are expected to be full-fledged journalists and work closely with reporters and editors.

Sep 7th 2026
5-12 Weeks
Math for MBA and GMAT Prep (Coursera) Coursera
Emory University

Math for MBA and GMAT Prep (Coursera)

This course gives participants a basic understanding of statistics as they apply in business situations. A fair share of students considering MBA programs come from backgrounds that do not include a large amount of training in mathematics and statistics. Often, students find themselves at a disadvantage when they apply for or enroll in MBA programs. This course will give you the tools to understand how these business statistics are calculated for navigating the built-in formulas that are included in Excel, but also how to apply these formulas in an range of business settings and situations.

Sep 7th 2026
5-12 Weeks
Population Health: Predictive Analytics (Coursera) Coursera
Leiden University

Population Health: Predictive Analytics (Coursera)

Predictive analytics has a longstanding tradition in medicine. Developing better prediction models is a critical step in the pursuit of improved health care: we need these tools to guide our decision-making on preventive measures, and individualized treatments. In order to effectively use and develop these models, we must understand them better. In this course, you will learn how to make accurate prediction tools, and how to assess their validity. First, we will discuss the role of predictive analytics for prevention, diagnosis, and effectiveness. Then, we look at key concepts such as study design, sample size and overfitting.

Aug 31st 2026
4 Weeks
Improving Your Statistical Questions (Coursera) Coursera
Eindhoven University of Technology

Improving Your Statistical Questions (Coursera)

This course aims to help you to ask better statistical questions when performing empirical research. We will discuss how to design informative studies, both when your predictions are correct, as when your predictions are wrong. We will question norms, and reflect on how we can improve research practices to ask more interesting questions.

Sep 7th 2026
5-12 Weeks
Bioinformatic Methods II (Coursera) Coursera
University of Toronto

Bioinformatic Methods II (Coursera)

Large-scale biology projects such as the sequencing of the human genome and gene expression surveys using RNA-seq, microarrays and other technologies have created a wealth of data for biologists. However, the challenge facing scientists is analyzing and even accessing these data to extract useful information pertaining to the system being studied. This course focuses on employing existing bioinformatic resources – mainly web-based programs and databases – to access the wealth of data to answer questions relevant to the average biologist, and is highly hands-on.

Aug 31st 2026
5-12 Weeks
Python and Statistics for Financial Analysis (Coursera) Coursera
The Hong Kong University of Science and Technology - HKUST

Python and Statistics for Financial Analysis (Coursera)

Python is now becoming the number 1 programming language for data science. Due to python’s simplicity and high readability, it is gaining its importance in the financial industry. The course combines both python coding and statistical concepts and applies into analyzing financial data, such as stock data.

Sep 7th 2026
4 Weeks
Data intelligence for businesses and managers (Coursera) Coursera
Institut Mines-Telecom

Data intelligence for businesses and managers (Coursera)

With the proliferation of connected objects (computers, tablets, watches, etc.), huge masses of data are generated every second. This Big Data has led to the emergence of a data economy, where data is the main source of competitive advantage for companies. In this sense, data and its processing tools have become a strategic priority for companies, and the main gas pedal of their digital transformation.

Sep 7th 2026
5-12 Weeks
HI-FIVE: Health Informatics For Innovation, Value & Enrichment (Administrative/IT Perspective) (Coursera) Coursera
Columbia University

HI-FIVE: Health Informatics For Innovation, Value & Enrichment (Administrative/IT Perspective) (Coursera)

HI-FIVE (Health Informatics For Innovation, Value & Enrichment) Training is an approximately 10-hour online course designed by Columbia University in 2016, with sponsorship from the Office of the National Coordinator for Health Information Technology (ONC). The training is role-based and uses case scenarios. No additional hardware or software are required for this course. Our nation’s healthcare system is changing at a rapid pace.

Aug 31st 2026
4 Weeks
From Excel to Power BI (Coursera) Coursera
Knowledge Accelerators

From Excel to Power BI (Coursera)

Are you using Excel to manage, analyze, and visualize your data? Would you like to do more? Perhaps you've considered Power BI as an alternative, but have been intimidated by the idea of working in an advanced environment. The fact is, many of the same tools and mechanisms exist across both these Microsoft products. This means Excel users are actually uniquely positioned to transition to data modeling and visualization in Power BI! Using methods that will feel familiar, you can learn to use Power BI to make data-driven business decisions using large volumes of data.

Sep 7th 2026
1 Week
Supply Chain Analytics Essentials (Coursera) Coursera
Rutgers University

Supply Chain Analytics Essentials (Coursera)

In this introductory course to Supply Chain Analytics, I will take you on a journey to this fascinating area where supply chain management meets data analytics. You will learn real life examples on how analytics can be applied to various domains of a supply chain, from selling, to logistics, production and sourcing, to generate a significant social / economic impact.

Sep 7th 2026
4 Weeks