Introduction to R Programming for Data Science (Coursera)

Offered by IBM,
Introduction to R Programming for Data Science (Coursera)

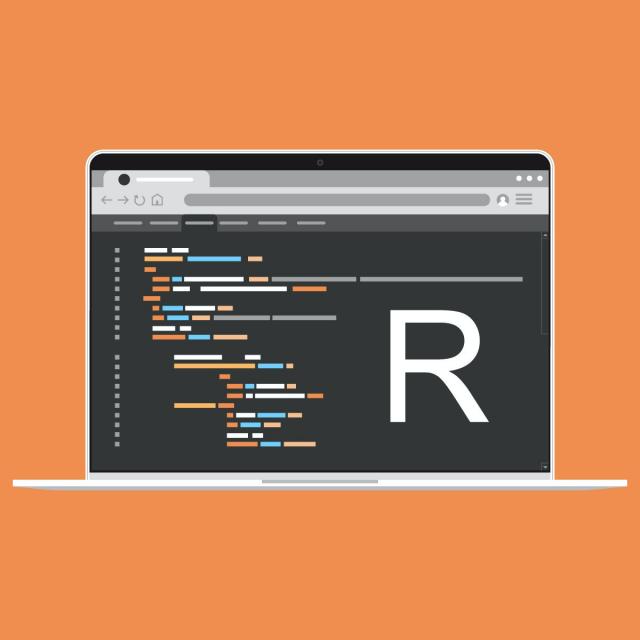
When working in the data science field you will definitely become acquainted with the R language and the role it plays in data analysis. This course introduces you to the basics of the R language such as data types, techniques for manipulation, and how to implement fundamental programming tasks. You will begin the process of understanding common data structures, programming fundamentals and how to manipulate data all with the help of the R programming language.

Class Deals by MOOC List - Click here and see Coursera's Active Discounts, Deals, and Promo Codes.

The emphasis in this course is hands-on and practical learning . You will write a simple program using RStudio, manipulate data in a data frame or matrix, and complete a final project as a data analyst using Watson Studio and Jupyter notebooks to acquire and analyze data-driven insights.
No prior knowledge of R, or programming is required.

What You Will Learn

  • Manipulate numeric and textual data types using the R programming language and RStudio or Jupyter Notebooks.
  • Define and manipulate R data structures, including vectors, factors, lists, and data frames.
  • Control program flow, define functions, perform character string and date operations, define regular expressions, and handle errors.
  • Read, write, and save data files and scrape web pages using R.

Course 1 of 5 in the Applied Data Science with R Specialization.

Syllabus

WEEK 1
R Basics
Regardless of the programming language you use, all share some commonalities. For example, you’ll likely need to perform basic operations on different data types, like applying mathematical equations to numeric data.
You’ll also need an environment in which to write your code, and most modern integrated development environments (or IDEs) provide features that make writing code easier, like syntax checking, color coding, and integrated help. This module introduces you to the R language, its common data types, and techniques for manipulating them. You’ll also learn about the role of the R interpreter and how it transforms code into executable objects. Finally, you’ll be introduced to two of the most common IDEs for R development: RStudio and Jupyter Notebook.

WEEK 2
Common Data Structures
The R language supports many types of data structures that you can use to organize and store values in your code, including vectors, factors, lists, arrays, matrices, and data frames. Each data structure type serves a specific purpose and can contain specific kinds of data. So, it’s important to understand the differences between them so you can make the right choice based on your scenario.
In this module, you’ll learn about the types of data you can store in each data structure and how to add, remove, or manipulate its contents.

WEEK 3
R Programming Fundamentals
As with most programming languages, R supports coding features that you can use to control the flow of program execution, define functions that can perform specific tasks, work with common data types, like strings and dates, and make your code more robust by intercepting likely errors and handling them before they interrupt the execution of your code.
In this module, you’ll learn how to implement these fundamental programming tasks in R.

WEEK 4
Working with Data
Data is everywhere! The data you need to analyze may come from a traditional database, but it may also come from a variety of different sources and systems, and it may come to you in one or more formats. For example, your data might be in text, Excel, .JSON, or .XML files. Or it may not be stored in a file at all, but instead lives on the pages of a website. How will you take all these different file formats and load them into your R working environment?
This module provides you with the tools you need to read data from some common file formats and sources into data objects that you can then use and combine with other data objects in your data analysis.

WEEK 5
Final Project

Go to Class
MOOC List is learner-supported. When you buy through links on our site, we may earn an affiliate commission.

Related Courses

Foundations of strategic business analytics (Coursera) Coursera
ESSEC Business School

Foundations of strategic business analytics (Coursera)

Who is this course for? This course is designed for students, business analysts, and data scientists who want to apply statistical knowledge and techniques to business contexts. For example, it may be suited to experienced statisticians, analysts, engineers who want to move more into a business role. You will find this course exciting and rewarding if you already have a background in statistics, can use R or another programming language and are familiar with databases and data analysis techniques such as regression, classification, and clustering.

Jun 8th 2026
4 Weeks
Getting started with TensorFlow 2 (Coursera) Coursera
Imperial College London

Getting started with TensorFlow 2 (Coursera)

Welcome to this course on Getting started with TensorFlow 2! In this course you will learn a complete end-to-end workflow for developing deep learning models with Tensorflow, from building, training, evaluating and predicting with models using the Sequential API, validating your models and including regularisation, implementing callbacks, and saving and loading models.

Jun 8th 2026
5-12 Weeks
What is Data Science? (Coursera) Coursera
IBM

What is Data Science? (Coursera)

The art of uncovering the insights and trends in data has been around since ancient times. The ancient Egyptians used census data to increase efficiency in tax collection and they accurately predicted the flooding of the Nile river every year. Since then, people working in data science have carved out a unique and distinct field for the work they do. This field is data science. In this course, we will meet some data science practitioners and we will get an overview of what data science is today.

Jun 8th 2026
3 Weeks
Introducción a Data Science: Programación Estadística con R (Coursera) Coursera
Universidad Nacional Autónoma de México

Introducción a Data Science: Programación Estadística con R (Coursera)

Este curso te proporcionará las bases del lenguaje de programación estadística R, la lengua franca de la estadística, el cual te permitirá escribir programas que lean, manipulen y analicen datos cuantitativos. Te explicaremos la instalación del lenguaje; también verás una introducción a los sistemas base de gráficos y al paquete para graficar ggplot2, para visualizar estos datos. Además también abordarás la utilización de uno de los IDEs más populares entre la comunidad de usuarios de R, llamado RStudio.

Jun 8th 2026
4 Weeks
Machine Learning Using SAS Viya (Coursera) Coursera
SAS

Machine Learning Using SAS Viya (Coursera)

This course covers the theoretical foundation for different techniques associated with supervised machine learning models. In addition, a business case study is defined to guide participants through all steps of the analytical life cycle, from problem understanding to model deployment, through data preparation, feature selection, model training and validation, and model assessment. A series of demonstrations and exercises is used to reinforce the concepts and the analytical approach to solving business problems.

Jun 8th 2026
5-12 Weeks
Statistical Inference (Coursera) Coursera
Johns Hopkins University

Statistical Inference (Coursera)

Statistical inference is the process of drawing conclusions about populations or scientific truths from data. There are many modes of performing inference including statistical modeling, data oriented strategies and explicit use of designs and randomization in analyses. Furthermore, there are broad theories (frequentists, Bayesian, likelihood, design based, …) and numerous complexities (missing data, observed and unobserved confounding, biases) for performing inference.

Jun 8th 2026
4 Weeks
Communicating Data Science Results (Coursera) Coursera
University of Washington

Communicating Data Science Results (Coursera)

Making predictions is not enough! Effective data scientists know how to explain and interpret their results, and communicate findings accurately to stakeholders to inform business decisions. Visualization is the field of research in computer science that studies effective communication of quantitative results by linking perception, cognition, and algorithms to exploit the enormous bandwidth of the human visual cortex. In this course you will learn to recognize, design, and use effective visualizations.

Jun 8th 2026
3 Weeks
Managing Machine Learning Projects with Google Cloud (Coursera) Coursera
Google Cloud

Managing Machine Learning Projects with Google Cloud (Coursera)

Business professionals in non-technical roles have a unique opportunity to lead or influence machine learning projects. If you have questions about machine learning and want to understand how to use it, without the technical jargon, this course is for you. Learn how to translate business problems into machine learning use cases and vet them for feasibility and impact.

Jun 8th 2026
4 Weeks
Practical Machine Learning (Coursera) Coursera
Johns Hopkins University

Practical Machine Learning (Coursera)

One of the most common tasks performed by data scientists and data analysts are prediction and machine learning. This course will cover the basic components of building and applying prediction functions with an emphasis on practical applications. The course will provide basic grounding in concepts such as training and tests sets, overfitting, and error rates.

Jun 8th 2026
4 Weeks
Introduction to Data Science in Python (Coursera) Coursera
University of Michigan

Introduction to Data Science in Python (Coursera)

This course will introduce the learner to the basics of the python programming environment, including fundamental python programming techniques such as lambdas, reading and manipulating csv files, and the numpy library. The course will introduce data manipulation and cleaning techniques using the popular python pandas data science library and introduce the abstraction of the Series and DataFrame as the central data structures for data analysis, along with tutorials on how to use functions such as groupby, merge, and pivot tables effectively. By the end of this course, students will be able to take tabular data, clean it, manipulate it, and run basic inferential statistical analyses.

Jun 8th 2026
4 Weeks
Understanding China, 1700-2000: A Data Analytic Approach, Part 2 (Coursera) Coursera
The Hong Kong University of Science and Technology - HKUST

Understanding China, 1700-2000: A Data Analytic Approach, Part 2 (Coursera)

The purpose of this course is to summarize new directions in Chinese history and social science produced by the creation and analysis of big historical datasets based on newly opened Chinese archival holdings, and to organize this knowledge in a framework that encourages learning about China in comparative perspective. Our course demonstrates how a new scholarship of discovery is redefining what is singular about modern China and modern Chinese history.

Jun 8th 2026
4 Weeks