Data Visualization and D3.js (Udacity)

Offered by Udacity, Zipfian Academy,
Data Visualization and D3.js (Udacity)

Communicating with Data. Learn the fundamentals of data visualization and practice communicating with data. This course covers how to apply design principles, human perception, color theory, and effective storytelling to data visualization. If you present data to others, aspire to be an analyst or data scientist, or if you’d like to become more technical with visualization tools, then you can grow your skills with this course.

Class Deals by MOOC List - Click here and see Udacity's Active Discounts, Deals, and Promo Codes.

The course does not cover exploratory approaches to discover insights about data. Instead, the course focuses on how to visually encode and present data to an audience once an insight has been found.
This course is part of the Data Analyst Nanodegree.
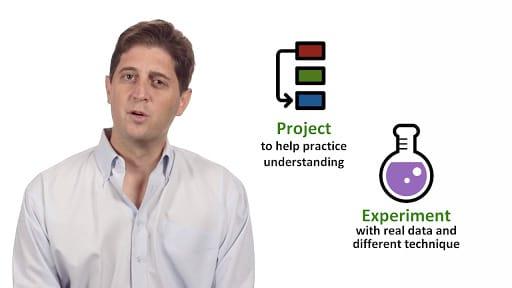
Learn by doing! You will analyze existing data visualization and create new ones to learn about the field. At it’s core, data visualization is a form of communication. Learn how to be a great communicator and how to enable readers to walk away from your graphics with insight and understanding. This course also makes use of open web standards (HTML, CSS, and SVG) to create data visualizations.
You can also learn how to...

  • communicate clearly with the best visual representation of your data
  • tell stories, spark discussion, and create calls to actions for readers
  • design graphics like ones from the NYTimes and other media companies
  • how to use open web technologies to create an online portfolio of your work
  • use visualization libraries (dimple.js and D3.js) to create graphics

What You Will Learn

Lesson 1
Visualization Fundamentals

  • Learn about the elements of great data visualization.
  • Meet data visualization experts
  • learn about data visualization in the context of data science.
  • Learn how to represent data values in visual form.

Lesson 2
Building Blocks

  • Learn how to use the open standards of the web to create graphical elements.
  • Select elements on the page
  • add SVG elements
  • and how to style SVG elements.
  • Instructor Notes throughout this lesson are available if you have little or no experience with HTML and CSS.

Lesson 3
Design Principles
Which chart type to use for a data set.

  • Colors to avoid when making graphics.
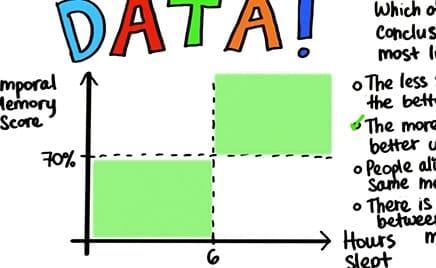
  • How to determine if a graphic is effective.

Lesson 4
Dimple js
Create graphics using the Dimple JavaScript library.

  • Learn about this library as a gentle coding introduction before learning about D3.js.
  • Produce great graphics with minimal code and interactivity without any extra effort.

Lesson 5
Narratives

  • Learn how to incorporate different narrative structures into your visualizations.
  • Learn about bias in the data visualization process and learn how to add context.

Lesson 6
Animation and Interaction

  • Learn how to leverage animation and interaction to bring more data insights to your audience.
  • Learn how to create a bubble map for the World Cup data set.

Prerequisites and Requirements
Regardless of your programming background, you can learn about data visualization and design principles in Lesson 1a and Lesson 2a without the following recommended background.
To succeed in this course, you should to be familiar with basic programming principles, including data types (strings, arrays, booleans, etc.), if else statements, and for loops. You should also be able to describe concepts like functions and objects. Our Intro to Computer Science and Programming Fundamentals with Python courses are great places to get started.
Basic knowledge of HTML and CSS (structuring and styling a web page) is not required but highly recommended. We suggest taking the Intro to HTML and CSS course if you have no experience with HTML or CSS.
This course is unique in that the final project can be completed using either dimple.js or d3.js. The visualization library, dimple.js, is easier to use than d3.js and requires less background knowledge. Furthermore, a graphic can be created in considerably fewer lines of code using dimple.js as opposed to d3.js.
So why should you learn d3.js?
Data Driven Documents (d3.js) allows you to build highly customized graphics. If you would like to gain more technical skills and learn more about Javascript and open web standards, then you should complete Lesson 3 and Lesson 4 in order to prepare for the final project.
If you would like to complete the final project using d3.js, you should have some experience reading and using documentation. For example, you should be able to code a for loop in Javascript or be able to look up the syntax to work with strings and arrays in Javascript. We recommend taking the Javascript Basics course if you have little to no experience with Javascript.

Go to Class
MOOC List is learner-supported. When you buy through links on our site, we may earn an affiliate commission.

Related Courses

Statistical Inference (Coursera) Coursera
Johns Hopkins University

Statistical Inference (Coursera)

Statistical inference is the process of drawing conclusions about populations or scientific truths from data. There are many modes of performing inference including statistical modeling, data oriented strategies and explicit use of designs and randomization in analyses. Furthermore, there are broad theories (frequentists, Bayesian, likelihood, design based, …) and numerous complexities (missing data, observed and unobserved confounding, biases) for performing inference.

Jun 15th 2026
4 Weeks
Real-Time Analytics with Apache Storm (Udacity) Udacity
Udacity,Twitter

Real-Time Analytics with Apache Storm (Udacity)

The world is trending in real time! Learn from Twitter to scalably process tweets, or any big data stream, in real-time to drive d3 visualizations using Apache Storm, the "Hadoop of Real Time." Storm is free, open source, and fun to use! Learn from Karthik Ramasamy, about the distributed, fault-tolerant, and flexible technology used to power Twitter’s real-time data flow pipeline. Twitter open sourced Storm in 2011, and it graduated to a top-level Apache project in September, 2014.

Self Paced
Self-Paced
Ask Questions to Make Data-Driven Decisions (Coursera) Coursera
Google

Ask Questions to Make Data-Driven Decisions (Coursera)

This is the second course in the Google Data Analytics Certificate. These courses will equip you with the skills needed to apply to introductory-level data analyst jobs. You’ll build on your understanding of the topics that were introduced in the first Google Data Analytics Certificate course. The material will help you learn how to ask effective questions to make data-driven decisions, while connecting with stakeholders’ needs. Current Google data analysts will continue to instruct and provide you with hands-on ways to accomplish common data analyst tasks with the best tools and resources.

Jun 16th 2026
4 Weeks
Human-Computer Interaction (Udacity) Udacity
Georgia Institute of Technology,Udacity

Human-Computer Interaction (Udacity)

This course is an introductory course on human-computer interaction, covering the principles, techniques, and open areas of development in HCI. The class covers three broad categories of topics within human-computer interaction: (a) the principles and characteristics of the interaction between humans and computers; (b) the techniques for designing and evaluating user-centered systems; and (c) current areas of cutting-edge research and development in human-computer interaction.

Self Paced
Self-Paced
Data Visualization and Communication with Tableau (Coursera) Coursera
Duke University

Data Visualization and Communication with Tableau (Coursera)

One of the skills that characterizes great business data analysts is the ability to communicate practical implications of quantitative analyses to any kind of audience member. Even the most sophisticated statistical analyses are not useful to a business if they do not lead to actionable advice, or if the answers to those business questions are not conveyed in a way that non-technical people can understand. In this course you will learn how to become a master at communicating business-relevant implications of data analyses.

Jun 15th 2026
5-12 Weeks
Intro to Descriptive Statistics (Udacity) Udacity
Udacity

Intro to Descriptive Statistics (Udacity)

Mathematics for Understanding Data. Statistics is an important field of math that is used to analyze, interpret, and predict outcomes from data. Descriptive statistics will teach you the basic concepts used to describe data. This is a great beginner course for those interested in Data Science, Economics, Psychology, Machine Learning, Sports analytics and just about any other field.

Self Paced
Self-Paced
Spark (Udacity) Udacity
Udacity,Insight

Spark (Udacity)

Master how to work with big data and build machine learning models at scale using Spark! In this course, you’ll learn how to use Spark to work with big data and build machine learning models at scale, including how to wrangle and model massive datasets with PySpark, the Python library for interacting with Spark. In the first lesson, you will learn about big data and how Spark fits into the big data ecosystem. In lesson two, you will be practicing processing and cleaning datasets to get comfortable with Spark’s SQL and dataframe APIs. In the third lesson, you will debug and optimize your Spark code when running on a cluster. In lesson four, you will use Spark’s Machine Learning Library to train machine learning models at scale.

Self Paced
Self-Paced
Model Building and Validation (Udacity) Udacity
Udacity

Model Building and Validation (Udacity)

Advanced Techniques for Analyzing Data. This course will teach you how to start from scratch in answering questions about the real world using data. Machine learning happens to be a small part of this process. The model building process involves setting up ways of collecting data, understanding and paying attention to what is important in the data to answer the questions you are asking, finding a statistical, mathematical or a simulation model to gain understanding and make predictions.

Self Paced
Self-Paced
Hadoop Platform and Application Framework (Coursera) Coursera
University of California, San Diego

Hadoop Platform and Application Framework (Coursera)

This course is for novice programmers or business people who'd like to understand the core tools used to wrangle and analyze big data. With no prior experience, you'll have the opportunity to walk through hands-on examples with Hadoop and Spark frameworks, two of the most common in the industry. You will be comfortable explaining the specific components and basic processes of the Hadoop architecture, software stack, and execution environment.

Jun 15th 2026
5-12 Weeks
Data Analysis and Visualization (Udacity) Udacity
Georgia Institute of Technology,Udacity

Data Analysis and Visualization (Udacity)

Data and visual analytics is an emerging field concerned with analyzing, modeling, and visualizing complex high dimensional data. This course will introduce students to the field by covering state­-of-­the-art modeling, analysis and visualization techniques. It will emphasize practical challenges involving complex real world data and include several case studies and hands-on work with the R programming language.

Self Paced
Self-Paced