Data Acquisition, Risk, and Estimation (Coursera)

Data Acquisition, Risk, and Estimation (Coursera)

Engineering and Business professionals often have access to many sources of data. The best way to way to ensure your data is both valid and reliable is to plan for it ahead of time. Through this class, you will be able to plan for accurate and precise data generation, then use that data for the purpose of estimation and risk reduction related to capital investments.

Class Deals by MOOC List - Click here and see Coursera's Active Discounts, Deals, and Promo Codes.

What You Will Learn

  • Create a plan to answer business and engineering questions.
  • Calculate effect size, power and sample size to reduce risk in decision making.
  • Distinguish between best- and worst-case scenarios given point and interval estimates.

Syllabus

WEEK 1
Fundamentals of Sampling
Upon completion of this module, students will be able to classify types of sampling used for data acquisition, describe sampling error, and construct random number sequences for sampling.

WEEK 2
Estimation
Upon completion of this module, students will be able to calculate point and interval estimates using RStudio and ROIStat.

WEEK 3
Best Case / Worst Case Analysis
Upon completion of this module, students will be able to use point and interval estimates to determine best- and worst-case scenarios.

WEEK 4
Foundations of Hypothesis Testing
Upon completion of this module, students will be able to plan for data acquisition to minimize risk in decision making, including sample size, effect size and power calculations.

WEEK 5
Essentials for Effect Size Calculations
Upon completion of this module, students will be able to use return on investment calculations to determine effect size, sample size and power using RStudio and ROIStat.


Go to Class
MOOC List is learner-supported. When you buy through links on our site, we may earn an affiliate commission.

Related Courses

Necessary Condition Analysis (NCA) (Coursera) Coursera
Erasmus University Rotterdam

Necessary Condition Analysis (NCA) (Coursera)

Welcome to Necessary Condition Analysis (NCA). NCA analyzes data using necessity logic. A necessary condition implies that if the condition is not in place, there will be guaranteed failure of the outcome. The opposite however is not true; if the condition is in place, success of the outcome is not guaranteed.

Oct 26th 2026
5-12 Weeks
Introduction to advanced tomography (Coursera) Coursera
Technical University of Denmark - DTU

Introduction to advanced tomography (Coursera)

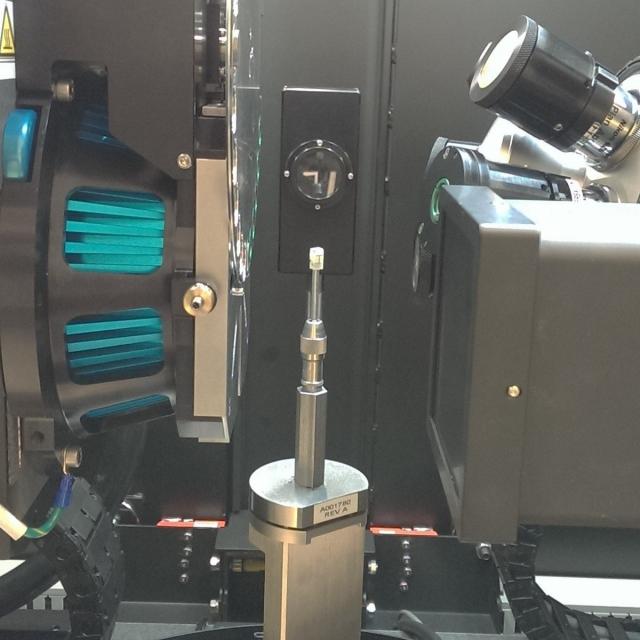
In this course you get the chance to get teaching and hands-on experience with the complete workflow of high-resolution tomography analysis. You will get introduced to data acquisition, 3D reconstruction, segmentation and meshing and, finally, 3D modelling of data to extract physical parameters describing mechanical and flow properties. The teaching and the exercises will take place in close interaction with top experts in the field. Exercises will require some basic programming skills, and will be carried out in a common python environment.

Oct 26th 2026
4 Weeks
Data Visualization with Tableau Project (Coursera) Coursera
University of California, Davis

Data Visualization with Tableau Project (Coursera)

In this project-based course, you will follow your own interests to create a portfolio worthy single-frame viz or multi-frame data story that will be shared on Tableau Public. You will use all the skills taught in this Specialization to complete this project step-by-step, with guidance from your instructors along the way.

Nov 2nd 2026
5-12 Weeks
Python and Statistics for Financial Analysis (Coursera) Coursera
The Hong Kong University of Science and Technology - HKUST

Python and Statistics for Financial Analysis (Coursera)

Python is now becoming the number 1 programming language for data science. Due to python’s simplicity and high readability, it is gaining its importance in the financial industry. The course combines both python coding and statistical concepts and applies into analyzing financial data, such as stock data.

Nov 2nd 2026
4 Weeks
Population Health: Responsible Data Analysis (Coursera) Coursera
Leiden University

Population Health: Responsible Data Analysis (Coursera)

In most areas of health, data is being used to make important decisions. As a health population manager, you will have the opportunity to use data to answer interesting questions. In this course, we will discuss data analysis from a responsible perspective, which will help you to extract useful information from data and enlarge your knowledge about specific aspects of interest of the population.

Nov 2nd 2026
4 Weeks
Data science perspectives on pandemic management (Coursera) Coursera
Politecnico di Milano

Data science perspectives on pandemic management (Coursera)

The COVID-19 pandemic is one of the first world-wide scenarios where data made a difference in capturing and analyzing the diffusion and impact of the disease. We offer an introductory course for decision makers, policy makers, public bodies, NGOs, and private organizations about methods, tools, and experiences on the use of data for managing current and future pandemic scenarios.

Nov 2nd 2026
5-12 Weeks
Practical Time Series Analysis (Coursera) Coursera
The State University of New York

Practical Time Series Analysis (Coursera)

Many of us are "accidental" data analysts. We trained in the sciences, business, or engineering and then found ourselves confronted with data for which we have no formal analytic training. This course is designed for people with some technical competencies who would like more than a "cookbook" approach, but who still need to concentrate on the routine sorts of presentation and analysis that deepen the understanding of our professional topics.

Nov 2nd 2026
5-12 Weeks
Understanding Clinical Research: Behind the Statistics (Coursera) Coursera
University of Cape Town

Understanding Clinical Research: Behind the Statistics (Coursera)

If you’ve ever skipped over`the results section of a medical paper because terms like “confidence interval” or “p-value” go over your head, then you’re in the right place. You may be a clinical practitioner reading research articles to keep up-to-date with developments in your field or a medical student wondering how to approach your own research. Greater confidence in understanding statistical analysis and the results can benefit both working professionals and those undertaking research themselves.

Oct 26th 2026
5-12 Weeks
HI-FIVE: Health Informatics For Innovation, Value & Enrichment (Administrative/IT Perspective) (Coursera) Coursera
Columbia University

HI-FIVE: Health Informatics For Innovation, Value & Enrichment (Administrative/IT Perspective) (Coursera)

HI-FIVE (Health Informatics For Innovation, Value & Enrichment) Training is an approximately 10-hour online course designed by Columbia University in 2016, with sponsorship from the Office of the National Coordinator for Health Information Technology (ONC). The training is role-based and uses case scenarios. No additional hardware or software are required for this course. Our nation’s healthcare system is changing at a rapid pace.

Oct 26th 2026
4 Weeks