Introduction to the Tidyverse (Coursera)

Introduction to the Tidyverse (Coursera)

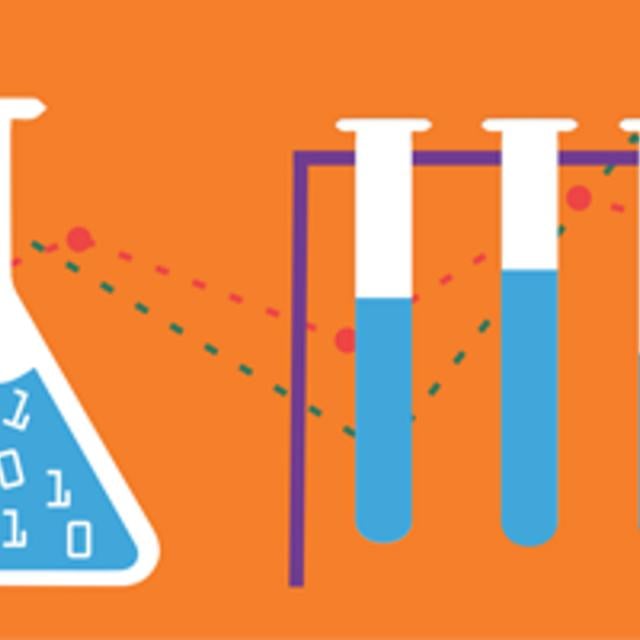
This course introduces a powerful set of data science tools known as the Tidyverse. The Tidyverse has revolutionized the way in which data scientists do almost every aspect of their job. We will cover the simple idea of "tidy data" and how this idea serves to organize data for analysis and modeling. We will also cover how non-tidy can be transformed to tidy data, the data science project life cycle, and the ecosystem of Tidyverse R packages that can be used to execute a data science project.

Class Deals by MOOC List - Click here and see Coursera's Active Discounts, Deals, and Promo Codes.

If you are new to data science, the Tidyverse ecosystem of R packages is an excellent way to learn the different aspects of the data science pipeline, from importing the data, tidying the data into a format that is easy to work with, exploring and visualizing the data, and fitting machine learning models. If you are already experienced in data science, the Tidyverse provides a power system for streamlining your workflow in a coherent manner that can easily connect with other data science tools.
In this course it is important that you be familiar with the R programming language. If you are not yet familiar with R, we suggest you first complete R Programming before returning to complete this course.

What You Will Learn

  • Distinguish between tidy and non-tidy data
  • Describe how non-tidy data can be transformed into tidy data
  • Describe the Tidyverse ecosystem of packages
  • Organize and initialize a data science project

Course 1 of 5 in the Tidyverse Skills for Data Science in R Specialization

Syllabus

WEEK 1
Tidy Data
Before we can discuss all the ways in which R makes it easy to work with tidy data, we have to first be sure we know what tidy data are. Tidy datasets, by design, are easier to manipulate, model, and visualize because the tidy data principles that we’ll discuss in this course impose a general framework and a consistent set of rules on data. In fact, a well-known quote from Hadley Wickham is that “tidy datasets are all alike but every messy dataset is messy in its own way.” Utilizing a consistent tidy data format allows for tools to be built that work well within this framework, ultimately simplifying the data wrangling, visualization and analysis processes. By starting with data that are already in a tidy format or by spending the time at the beginning of a project to get data into a tidy format, the remaining steps of your data science project will be easier.

WEEK 2
From Non-Tidy –>Tidy
The reason it’s important to discuss what tidy data are an what they look like is because out in the world, most data are untidy. If you are not the one entering the data but are instead handed the data from someone else to do a project, more often than not, those data will be untidy. Untidy data are often referred to simply as messy data. In order to work with these data easily, you’ll have to get them into a tidy data format. This means you’ll have to fully recognize untidy data and understand how to get data into a tidy format. The following common problems seen in messy datasets again come from Hadley Wickham’s paper on tidy data. After briefly reviewing what each common problem is, we will then take a look at a few messy datasets. We’ll finally touch on the concepts of tidying untidy data, but we won’t actually do any practice yet. That’s coming soon!
The Data Science Life Cycle & Tidyverse Ecosystem
With a solid understanding of tidy data and how tidy data fit into the data science life cycle, we’ll take a bit of time to introduce you to the tidyverse and tidyverse-adjacent packages that we’ll be teaching and using throughout this specialization. Taken together, these packages make up what we’re referring to as the tidyverse ecosystem. The purpose for the rest of this course is not for you to understand how to use each of these packages (that’s coming soon!), but rather to help you familiarize yourself with which packages fit into which part of the data science life cycle.
Note that the official tidyverse packages below are bold. All other packages are tidyverse-adjacent, meaning they follow the same conventions as the official tidyverse packages and work well within the tidy framework and structure of data analysis.

WEEK 3
Data Science Project Organization & Workflows
Data science projects vary quite a lot so it can be difficult to give universal rules for how they should be organized. However, there are a few ways to organize projects that are commonly useful. In particular, almost all projects have to deal with files of various sorts—data files, code files, output files, etc. This section talks about how files work and how projects can be organized and customized.
Case Studies
Throughout this specialization, we’re going to make use of a number of case studies from Open Case Studies to demonstrate the concepts introduced in the course. We’ll generally make use of the same case studies throughout the specialization, providing continuity to allow you to focus on the concepts and skills being taught (rather than the context) while working with interesting data. These case studies aim to address a public-health question and all of them use real data.

WEEK 4
Project: Organizing a New Data Science Project
This project will allow you to create a new project and organize the files that will be needed to engage in a future data analysis

Go to Class
MOOC List is learner-supported. When you buy through links on our site, we may earn an affiliate commission.

Related Courses

Interprofessional Healthcare Informatics (Coursera) Coursera
University of Minnesota

Interprofessional Healthcare Informatics (Coursera)

Interprofessional Healthcare Informatics is a graduate-level, hands-on interactive exploration of real informatics tools and techniques offered by the University of Minnesota and the University of Minnesota's National Center for Interprofessional Practice and Education. We will be incorporating technology-enabled educational innovations to bring the subject matter to life. Over the 10 modules, we will create a vital online learning community and a working healthcare informatics network.

Jun 22nd 2026
5-12 Weeks
Mathematical Biostatistics Boot Camp 1 (Coursera) Coursera
Johns Hopkins University

Mathematical Biostatistics Boot Camp 1 (Coursera)

This class presents the fundamental probability and statistical concepts used in elementary data analysis. It will be taught at an introductory level for students with junior or senior college-level mathematical training including a working knowledge of calculus. A small amount of linear algebra and programming are useful for the class, but not required.

Jun 22nd 2026
4 Weeks
Framework for Data Collection and Analysis (Coursera) Coursera
University of Maryland, College Park

Framework for Data Collection and Analysis (Coursera)

This course will provide you with an overview over existing data products and a good understanding of the data collection landscape. With the help of various examples you will learn how to identify which data sources likely matches your research question, how to turn your research question into measurable pieces, and how to think about an analysis plan.

Jun 22nd 2026
4 Weeks
Statistical Inference (Coursera) Coursera
Johns Hopkins University

Statistical Inference (Coursera)

Statistical inference is the process of drawing conclusions about populations or scientific truths from data. There are many modes of performing inference including statistical modeling, data oriented strategies and explicit use of designs and randomization in analyses. Furthermore, there are broad theories (frequentists, Bayesian, likelihood, design based, …) and numerous complexities (missing data, observed and unobserved confounding, biases) for performing inference.

Jun 22nd 2026
4 Weeks
Foundations of strategic business analytics (Coursera) Coursera
ESSEC Business School

Foundations of strategic business analytics (Coursera)

Who is this course for? This course is designed for students, business analysts, and data scientists who want to apply statistical knowledge and techniques to business contexts. For example, it may be suited to experienced statisticians, analysts, engineers who want to move more into a business role. You will find this course exciting and rewarding if you already have a background in statistics, can use R or another programming language and are familiar with databases and data analysis techniques such as regression, classification, and clustering.

Jun 22nd 2026
4 Weeks
The Data Scientist's Toolbox (Coursera) Coursera
Johns Hopkins University

The Data Scientist's Toolbox (Coursera)

In this course you will get an introduction to the main tools and ideas in the data scientist's toolbox. The course gives an overview of the data, questions, and tools that data analysts and data scientists work with. There are two components to this course. The first is a conceptual introduction to the ideas behind turning data into actionable knowledge. The second is a practical introduction to the tools that will be used in the program like version control, markdown, git, GitHub, R, and RStudio.

Jun 22nd 2026
4 Weeks
Machine Learning Foundations: A Case Study Approach (Coursera) Coursera
University of Washington

Machine Learning Foundations: A Case Study Approach (Coursera)

Do you have data and wonder what it can tell you? Do you need a deeper understanding of the core ways in which machine learning can improve your business? Do you want to be able to converse with specialists about anything from regression and classification to deep learning and recommender systems? In this course, you will get hands-on experience with machine learning from a series of practical case-studies.

Jun 22nd 2026
5-12 Weeks
Business Intelligence Concepts, Tools, and Applications (Coursera) Coursera
University of Colorado System

Business Intelligence Concepts, Tools, and Applications (Coursera)

This is the fourth course in the Data Warehouse for Business Intelligence specialization. Ideally, the courses should be taken in sequence. In this course, you will gain the knowledge and skills for using data warehouses for business intelligence purposes and for working as a business intelligence developer. You’ll have the opportunity to work with large data sets in a data warehouse environment and will learn the use of MicroStrategy's Online Analytical Processing (OLAP) and Visualization capabilities to create visualizations and dashboards.

Jun 22nd 2026
5-12 Weeks
Data Management for Clinical Research (Coursera) Coursera
Vanderbilt University

Data Management for Clinical Research (Coursera)

This course presents critical concepts and practical methods to support planning, collection, storage, and dissemination of data in clinical research. Understanding and implementing solid data management principles is critical for any scientific domain. Regardless of your current (or anticipated) role in the research enterprise, a strong working knowledge and skill set in data management principles and practice will increase your productivity and improve your science. Our goal is to use these modules to help you learn and practice this skill set.

Jun 22nd 2026
5-12 Weeks
Introduction to Genomic Technologies (Coursera) Coursera
Johns Hopkins University

Introduction to Genomic Technologies (Coursera)

This course introduces you to the basic biology of modern genomics and the experimental tools that we use to measure it. We'll introduce the Central Dogma of Molecular Biology and cover how next-generation sequencing can be used to measure DNA, RNA, and epigenetic patterns. You'll also get an introduction to the key concepts in computing and data science that you'll need to understand how data from next-generation sequencing experiments are generated and analyzed.

Jun 22nd 2026
4 Weeks