Learn and use data skills to work for change. In this course you will learn how to analyze issues of injustice and structural inequality by applying methods in R. Through the ethical practice of data science, you will use data to illuminate social justice issues wherever you live and work.
Class Deals by MOOC List - Click here and see EdX's Active Discounts, Deals, and Promo Codes.
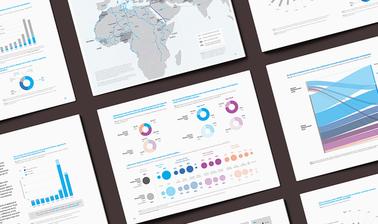
This four-week course will build on your current R skills, empowering you to use data to work for social change. You will look at data through the lens of social justice and gain an understanding of what characteristics of society are correlated with economic mobility, as well as how inequities are embodied in systems of education, housing, and health. You will analyze and communicate data using accurate, unbiased, and well-designed visualizations, including bar graphs, boxplots, and histograms.
What you'll learn
- Apply data science methods to illuminate and analyze issues of injustice or structural inequality
- Communicate clearly and persuasively with data, using accurate, unbiased and aesthetically pleasing visualizations
- Reflect on inequities across different communities and regions through the lens of data
Prerequisites:
The following prerequisites are needed to be successful in this course and can be accessed in Essentials for Data Literacy if needed.
access R and RStudio
install tidyverse
load data from Excel spreadsheet or .csv
recognize categorical / non-categorical variables
work with projects in R
use R Markdown files